
Jan's Working with Numbers
Formulas: Subtotals
Creating groups within your data is generally done so you can do subtotals or other calculations using the records in a group.
Excel provides help by letting you use its Sort command and then its Subtotal command. With these commands you can sort a plain list of sales and then automatically create subtotals. The subtotals can even be functions besides SUM, like AVERAGE, MAX or MIN.
You might want to see sales for each salesman, or in a geographic area, or for each product sold, or for a day, week, or month in which the sales took place.
Example: Computer Widgets Inc Sales - Sorting by salesman to subtotal
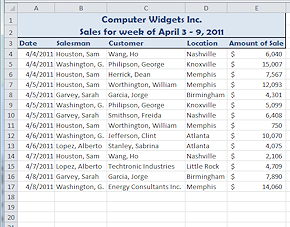
Original data as entered
Sorted on Salesman, then Date
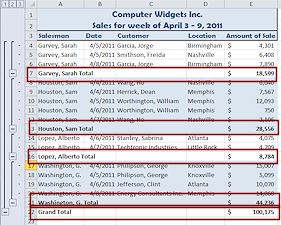
Subtotaled on Amount of Sale
Sorting and Formulas
Sorting and subtotaling often mess up formulas that were already in place. You will need to learn how to repair the damage. For example it is easy to get a total for the table that includes the subtotals as well as the data values, doubling the total that you really wanted.
![]() Use Multiple Sheets: Put the data that you want to subtotal on a new sheet and leave the original data in place. After all, you might get another spiffy idea
later and want to sort and group the original data differently.
Use Multiple Sheets: Put the data that you want to subtotal on a new sheet and leave the original data in place. After all, you might get another spiffy idea
later and want to sort and group the original data differently.
Pivot Table and Pivot Chart
 Another
way to subtotal data is with a pivot table.
From your original data you pick 3 columns. Two of these are used for row
and column labels in the new pivot table and the third contains the values
that you want to Sum.
Another
way to subtotal data is with a pivot table.
From your original data you pick 3 columns. Two of these are used for row
and column labels in the new pivot table and the third contains the values
that you want to Sum.
Example: Computer Widgets Inc Sales - Pivot table by salesman and dates
Using the original data from the example above, the pivot table in the illustration shows Salesman at the left and Date across the top. The intersection of a salesman and a date shows the total of sales for that date for that salesman.
The pivot chart in the illustration shows a bar for each sum in the table, but not for the grand totals.
The table and the chart both have drop lists where you can change which parts are displayed. Very interactive!
You can use other functions instead of Sum, like Count, Average, Max, and Min.
|
|
| © 1997-2017 Jan Smith All Rights Reserved |
Site Map What's New |
Privacy Policy Terms of Service Copyright Acknowledgements |
~~ 1 Cor. 10:31 ...whatever you do, do it all for the glory of God. ~~
Last updated: March 22, 2017