
Jan's Computer Basics:
Applications: Browser
An Internet browser is a program that lets you navigate the World Wide Web or view HTML pages on a CD or DVD or on your hard disk. [It's likely to be what you are using to view this page if you are reading this on a computer!]
A browser displays web pages, keeps track of where you've been, and remembers the places you want to return to.
More information is available over the Internet every day, and more tasks can be done. You can buy books, check on your bank account, buy and sell stocks, even order pizza over the Internet. But you have to have a browser to do it.
 |
 |
| Internet Explorer | Google Chrome |
Internet Explorer may no longer be the most popular browser [June 2012]. Mozilla FireFox has evolved from the original favorite browser, Netscape, and has become the favorite of many. But, Google's Chrome is gaining market share and may have passed IE. Safari is the browser that comes with Apple computers.
Browsers that are built into devices such as smart phones and tablets may be unique to the manufacturer or they may be simplified versions of PC browsers.
Modern browsers include many of the same features, such as tabs instead of separate windows to make it easy to move between several open pages, a list of previously viewed pages (History), a list of places you want to be able to get back to (Favorites or Bookmarks), the ability to install add-in programs to view videos in various formats or to interact with web pages.
| Purpose: |
|
| Major Advantage: |
|
Which is the most popular?
Which browsers are most popular changes over time. No one can actually count all of the visits to web sites! All of the numbers are estimates based on just a part of what is really happening in the world.
The numbers you hear about depend on:
- Equipment used to browse: desktop computer or a mobile device (Different browsers available!)
- Number of sites being counted (one, a few thousand, hundreds of thousands, millions)
- Location of the sites being counted (in one region, one country, or scattered around the world)
- Type of sites included (mostly similar or widely different; technology, social, business, government, education, sales)
The numbers below are from three different sources, including two that news headlines about browser wars seem to use most often, NetMarketShare and StatsCounter.
NetMarketShare stats:
The embedded interactive charts below show the statistics from the network of 40,000 sites that are HitsLink Analytics and SharePost clients. That sounds like a lot of sites, but the Internet has millions!
The arrows at the top left of each chart will change the date range so you can compare different time periods.
What trends do you see?
More statisitics: NetMarketShare: HitsLink.com:Desktop Browsers ![]()
HitsLink.com: Mobile/Tablet Browsers ![]()
StatCounter Global Stats
StatCounter Global Stats gets their statistics from the log files of the sites of its more than 3 million members around the world, who uses StatCounter to analyze data about visitors to their web sites. There were 18 billion page views in January 2012. That's a lot of data!
The embedded graph below shows the statistics for a recent year. Hover over a dot on the graph and a screen tip tells you the browser, percentage, and date.
Current Data: StatCounter Global Stats - Browser Market Share ![]()
W3School.com statistics - single site:
These statistics are only for visitors to the W3Schools site, which is a resource for people who are writing web pages. So the visitors to their pages are more likely to be in the "techie" group of browser users - and are probably picky about their browser, too! Quite a difference in which browsers are popular! What the 'techie' people favor tends to become popular with the general population after a while, but not always.
The site did not have charts and did not break down the data between desktop and mobile browsers. I took the numbers from their site and averaged the monthly percentages for each year. Then I made some pie charts. How do these statistics compare to the values from the other two sources?
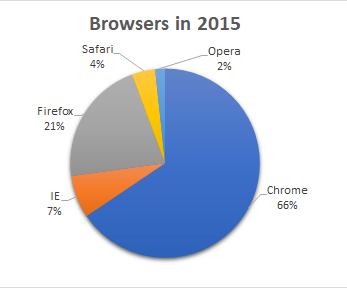
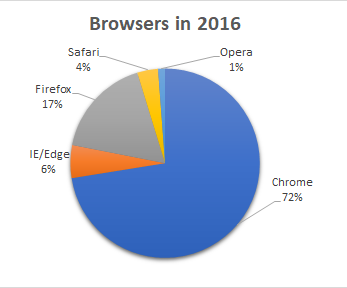
| IE/Edge | Firefox | Chrome | Safari | Opera | |
|---|---|---|---|---|---|
| 2016 | 5.54% | 16.94% | 71.51% | 3.51% | 1.18% |
| 2015 | 7.17% | 21.21% | 64.73% | 3.95% | 1.67% |
| 2014 | 9.23% | 24.83% | 59.01% | 3.78% | 1.73% |
| 2013 | 12.08% | 28.21% | 52.62% | 3.94% | 1.75% |
| 2012 | 17.20% | 34.07% | 41.42% | 4.26% | 2.18% |
| 2011 | 23.48% | 40.98% | 28.57% | 3.99% | 2.43% |
| 2010 | 31.75% | 45.65% | 15.98% | 3.69% | 2.21% |
| 2009 | 40.52% | 46.94% | 6.28% | 3.30% | 2.22% |
| 2008 | 51.63% | 40.94% | 3.20% | 2.43% | 1.81% |
For more statistics, including mobile browsers: w3schools.com stats ![]()
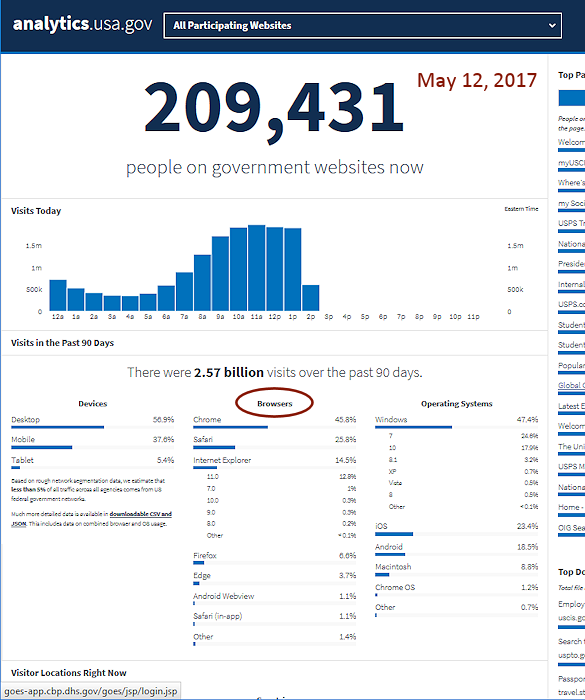
US Government Web Sites
People and businesses from around the world access the huge number of web sites attached to the US government. So this is a different population than the previous examples of statistics on browser useage.
For more on using a browser, see the section Working with the Web: Browser Basics![]()
|
|
| © 1997-2017 Jan Smith All Rights Reserved |
Site Map What's New |
Privacy Policy Terms of Service Copyright Acknowledgements |
~~ 1 Cor. 10:31 ...whatever you do, do it all for the glory of God. ~~
Last updated: May 12, 2017