
Jan's Working with Databases
Basics: Access Objects: Reports
A report organizes and groups your data for printing. You have more control over the content, arrangement, and look of a report than you do for a datasheet or even a form.
Examples below are from starwars.accdb ![]() .
.
Advantages of a Report
A report is designed for primarily for printing. It has advantages over a form or a datasheet for this purpose:
-
Precise management of the layout and look for printing
-
Can include summary information like totals and averages
-
Can group data, for example on year or region or postal code
Example: Report
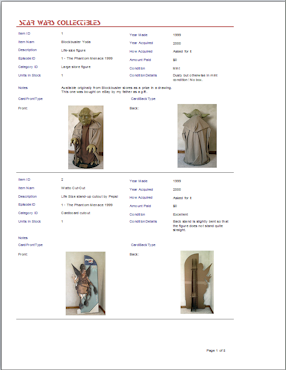
The simplest report just shows all of the records in a table.
The illustration shows a report that manages to get two records on the page and still show all of the fields in a record. The controls are nicely spaced out and the photos are large enough to be useful.
![]() Click the report to rotate through
Click the report to rotate through
each of its 8 pages.
A more complex report might group or filter records and can even include totals or averages.
Quick Reports
A well-designed report can be a complex thing.
Happily, Access
provides some quick methods for getting your report started.
These automatic methods
do not use the space on the page very well.
Of course you can rearrange things afterwards.
AutoReport
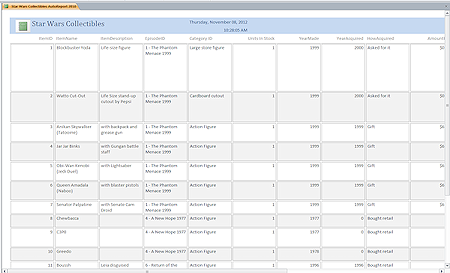
![]() The Report button on the Create ribbon tab immediately creates a report that is wide enough to show all of the fields in the selected table or query, apparently up to 15 fields. The report looks similar to a spreadsheet.
The Report button on the Create ribbon tab immediately creates a report that is wide enough to show all of the fields in the selected table or query, apparently up to 15 fields. The report looks similar to a spreadsheet.
The picture on the Report button shows rows and columns as a hint about what this button produces. This report is quite different from what was produced by the autoreport feature in earlier versions of Access.
In the illustration the scroll bar at the bottom shows that there are more fields off screen to the right. Only the first 15 fields are included at all. The original table had 18 fields. That is only a big problem if you don't know about this limit!
Report Wizard
 The Report Wizard button
 ![]()
![]() on the Create ribbon tab gives you some very helpful choices that let you create a more complex report.
on the Create ribbon tab gives you some very helpful choices that let you create a more complex report.
The Report Wizard produces a report that usually works better than the AutoReport, but it may still need adjustments.
Choices in Report Wizard:
- Pick multiple sources for the data
- Show all or only selected fields
- Group data on one or more fields, like by year or region or postal code
- Include summary data like totals or averages
- Sort using up to 4 fields
- Various layouts are available depending on what choices you made about grouping and summary data.
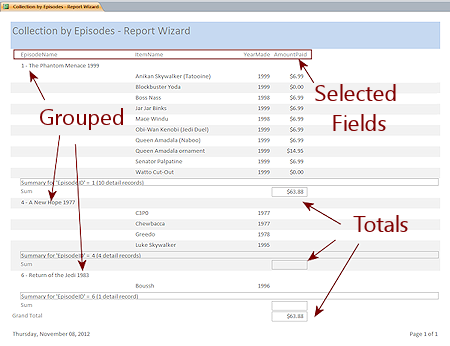
The illustration shows the results of using the report wizard - choosing one field from the Episodes table and three fields from the table Star Wars Collectibles. The report groups data by EpisodeName and totals the values for AmountPaid for each group. There is also a grand total at the bottom. (The blank totals are zero as the items were received as gifts.) Creating a similar report manually would be much trickier than making choices in the Report Wizard dialog!
Views
There are four views for reports: Report, Layout, Design, and Print Preview. You cannot change or edit the data itself in ANY view of a report.
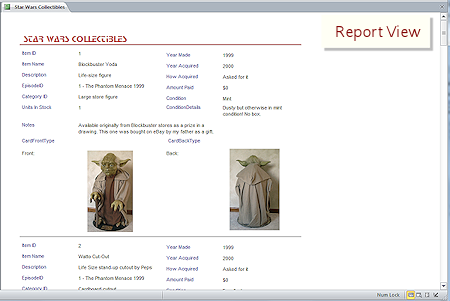
 Report View
The Report View show how the data will lay on the page but does not show page breaks. You can scroll through the records, which is a big help if you only need to look at the information on screen.
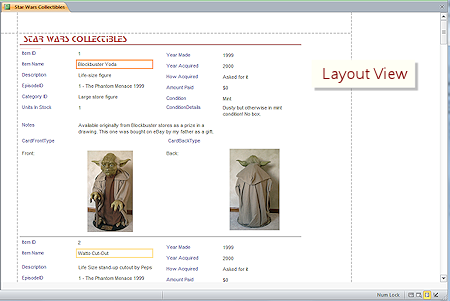
 Layout View
The Layout View acts like it did for forms. You can see data in the controls and resize and move those controls. If your report was created by AutoReport or Report Wizard, then the controls are in a layout table. Rows and columns will resize together.
Vertical dashed lines show where a wide record will break across pages. There are not any horizontal marks to show page breaks in that direction.
The number of records that can fit on a page depends on the number of fields in each record and the space needed to show the data. There may be several records on a page or only one. It may even take two pages (or more!) per record. You really want to avoid that!
 Report Design View
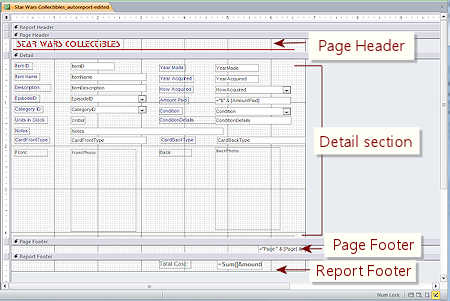 The
Report Design View is very similar to the Form Design View.
The
Report Design View is very similar to the Form Design View.
The fields for the report are displayed in controls with labels.
The page header and footer can hold a title or other information like page numbers that you want to see on each page.
The report header and footer can hold text, totals, and summaries that you want to see at the beginning or end of all of the records.
The Detail section contains the fields for one record. Since the Design View does not show data, you only need one set of Detail controls.
 Print Preview
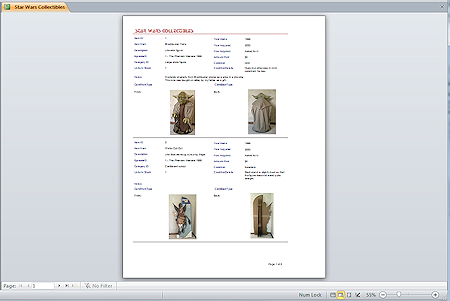 Unlike other programs in Office, Access puts its print preview in the same window as the other views.
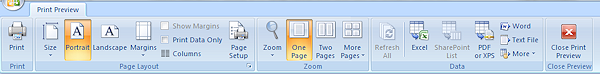
Print Preview Ribbon Tab: Contains commands about managing the printing and the page itself.
No other ribbon tabs show while in Print Preview.
![]() Access 2007:
Access 2007:
![]()
![]()
![]() Access 2010, 2013, 2016: Similar icons.
Access 2010, 2013, 2016: Similar icons.
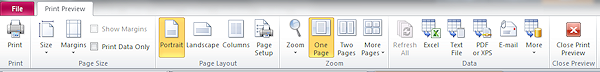
Page Layout tab group: Split into Page Size and Page Layout tab groups for Access 2010 and 2013.
Zoom tab group: Manages the size of the view in the window but does not affect the print-out.
Data tab group: Commands for exporting the report to another file type.
Question: How can you tell how many pages there are in the report?
This is important to know before you start printing! Access does not tell you directly. There are two ways to see how many pages it will take to print the report:
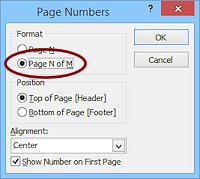 [Best] Include a control that inserts the number of pages in the page header or page footer, like
"Page 1 of 8". Both the AutoReport and the Report Wizard do this.
[Best] Include a control that inserts the number of pages in the page header or page footer, like
"Page 1 of 8". Both the AutoReport and the Report Wizard do this.
The Page Numbers button
 in Report Design View on the Design ribbon tab opens a small dialog. You can choose "Page N of M" and choose either Header or Footer for the location.
- Navigate to the last page and look at its number in the Navigation bar.
 Formatting Delay: Access must format the whole report before it
can display the last page. It may take a while. Awkward!
Formatting Delay: Access must format the whole report before it
can display the last page. It may take a while. Awkward!
For large reports on older computers or older versions of Access, this process can be worse than "awkward". The whole program can hang when trying to format a large report for printing. You might have to break your report up into smaller sets of records, especially if there is an image with each record.
|
|
| © 1997-2017 Jan Smith All Rights Reserved |
Site Map What's New |
Privacy Policy Terms of Service Copyright Acknowledgements |
~~ 1 Cor. 10:31 ...whatever you do, do it all for the glory of God. ~~
Last updated: March 22, 2017