
Jan's Working with Databases
Basics: Access Objects: Create Report
 An autoreport is a quick way to get fields onto a simple report, especially if you want to see all of the fields.
Advantage: It's a fast one-click process.
Disadvantages:
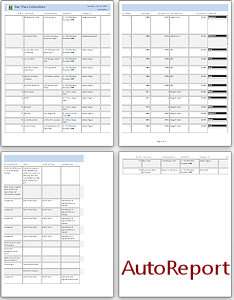
- One record may cross multiple pages. The illustration show that it takes 3 pages to show all of the fields for a record.
- Can only use a single table or query as the source of the records.
- All fields will be included automatically.
- Fields are placed in a Stacked Layout, which makes all of the controls in a column the same size.
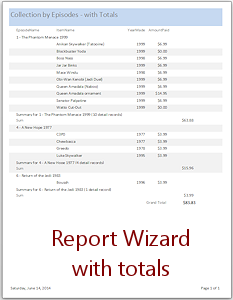 The Report Wizard can create several simple reports and automates creating totals.
Advantages:
- Can pick multiple sources from tables and queries.
- Can pick which fields to show.
- Can group records together for totals.
- The wizard walks you through the steps to create totals.
Once you have controls on the report, you can use Design View to move, resize, or format parts of the report.
| |
Step-by-Step: Create Report |
|
| What you will learn: | to create a report with AutoReport to resize controls in Layout View to create a report with Report Wizard to navigate pages in a report Print Preview to zoom the report preview size to edit with Property Sheet to edit with ribbon |
Start with: ![]() ,
,![]() , mytrips-Lastname-Firstname.accdb from previous lesson
, mytrips-Lastname-Firstname.accdb from previous lesson
Create a Report: AutoReport
A simple report is very easy to create with AutoReport. There are a number of things you could do to improve the layout. For this lesson we will make just a few changes. Later you will learn how to change all the characteristics of a report.
 If
necessary, open mytrips-Lastname-Firstname.accdb.
If
necessary, open mytrips-Lastname-Firstname.accdb.
 Back up this database now so you will have a good copy to use if you need to start over. This works well while the database is small.
 Access 2007:
  > Manage > Back Up Database
 Access 2010: File > Save and Publish > Back Up Database > Save As button
 Access 2013, 2016: File > Save As > Back Up Database > Save As button
- If
necessary, show Tables in the Navigation Pane.
The only table is Trips, so it will be selected automatically. This table will be the source of records for the new form.
-
On the Create ribbon tab click the button Report

 .
.
The screen may blink and you may briefly see a minimized window at the bottom of your Access window while Access creates the autoreport. The new report will open automatically in Layout View.
The report in this case is almost certainly too wide to fit in your window.
What your report looks like: Below is picture of the autoreport. Click on the picture to see it at normal size. Then you can scroll both horizontally and vertically. The report is slightly different in Access 2007, 2010, 2013, and 2016.
- In Access, scroll horizontally and vertically to see the whole report.
Pages: How many sheets of paper will it take to print this autoreport?
Scrolling horizontally you can see two page breaks (dashed vertical lines). That means that there will be at least 3 sheets of paper using Letter size paper. Will the 8 records fit vertically on one sheet? The Layout View does not give any hints! Only in Print Preview can you see the separate pages.
Features of an AutoReport:
Layout: All of the fields are in a table, like a spreadsheet. This is not like earlier versions of Access.
Cell Size: There seems to be a default minimum cell width for each data type. Cell height is allowed to grow large enough to show all of the cell's contents. In this report, the whole row has to be tall enough to handle the Diary field, which needs the most space for most records. That results in lots and lots of wasted space.
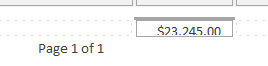 Grand Total: The autoreport put in a control that shows the total cost of all trips in the report. That's handy. But the control is not tall enough for the number to show clearly. That's odd.
AutoReport Page Numbers: Did you notice the 'Page 1 of 1' at the bottom of this autoreport? That clearly does not match what the dashed lines for page breaks tell us. While you are in Layout or Report View, Access sees the whole report as one very wide page. In this report the paper would have to be 21 inches wide. Not a common size! This is odd because the vertical lines show that Access knows it will take at least three pages.
![]() Records out
of order or missing:
Records out
of order or missing:
The report shows the records in the same way that the original source does, including any
sorting or filtering that you left in place.
Simple Solution: (for AutoReports)
Close and delete the AutoReport. Open the source table or query and remove
any filters, sort in the order that you want for the report, save the table or query. Recreate your
AutoReport.
Advanced Solution: (for complex or formatted reports that you don't want to
recreate)
Open the report in Report Design View. Open the Property Sheet for the report.
Remove the entry in the OrderBy and Filter properties and change the property Order By On Load to No.
Layout View: Make Changes
In both Layout View and Design View, if you move or resize a control, you are changing that control for ALL records. Use Layout View for changes that might cut off part of the data in the control. You can scroll through records to see if you have allowed enough space.
-
 Experiment: Resizing in Layout View
Do you suppose that you could resize the controls to make a record fit on one page?- Drag the right edge of a control to the left to make it smaller.
The whole column resizes. - Try different combinations of sizes for several controls to make the width as small as you think is reasonable. Can you get them on one page in Portrait orientation? How about Landscape?
- Drag the right edge of a control to the left to make it smaller.
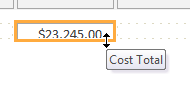 Scroll to the bottom of the report until you can see the control for the total cost of the trips.
Oddly, the control is too short to clearly show the whole number.- Move the mouse pointer over the bottom edge until the shape changes to the Resize Vertical shape
 .
.  Double-click.
The control resizes to the exact minimum height needed to show the whole number.- Scroll horizontally.
If you resized fields, you have a lot of empty space to the right. You did not resize the space allowed for fields yet. The whole report is still set at 21" wide! You cannot change this property from Layout View. You have to go to Design View. - Save Object As: new name, Trips AutoReport - Lastname, Firstname, using your own first and last names:
Access 2007: Office button > Save As > Save Object As Access 2010, 2013, 2016: File tab > Save Object As -
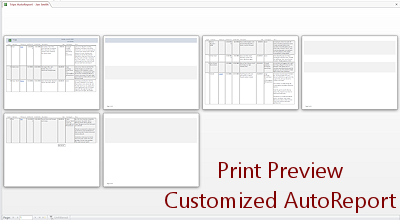
 Open Print Preview of your customized autoreport.
There are still 6 pages, but some of them have no data, just colored bars and the page footer. That is from the report's width being set to 21".Your report may look quite different from the illustration.
- Close all open objects but don't close the database.
We could spend some time fixing this autoreport, but it would still waste a lot of space in each record. Instead let's try the Report Wizard.
Create a Report: Report Wizard
After just a little playing around with the autoreport, it seems clear that this layout is often not a good choice, if there are many fields to show or if some fields have a lot more text to show than others. The Report Wizard gives you many more options. It is a big help in getting a report started when you want to group and subtotal results. That can be rather tricky to set up manually.
- If necessary, select the Trips table in the Navigation pane again.
-
 On the Create ribbon tab click the button Report Wizard
  .
.
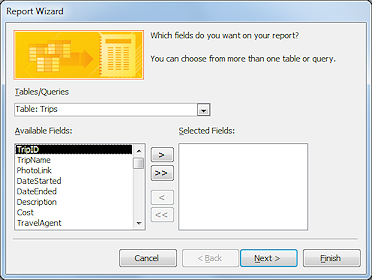
The Report Wizard dialog opens.On this page of the dialog, you will pick which items to use as a source from the Tables/Queries drop list. For each one you pick, you then pick one or more fields in the Available Fields and move them to the Selected Fields column. This is MUCH more flexible than the Report button!
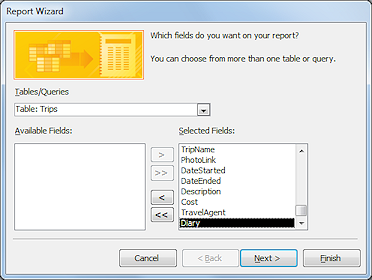 With Table: Trips showing in the Tables/Queries box, click the >> button between the columns to move ALL fields to the Selected Fields column.
-
Click the Next > button to move to the next page of the dialog.
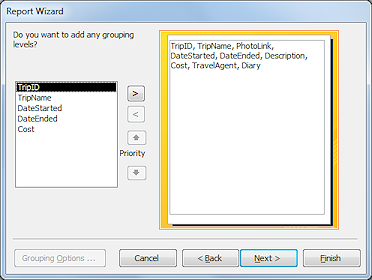 The next page lets you group records together, for example by TravelAgent. We won't do that this time.
 -
If necessary, click the < button to remove grouping.
-
Click on the Next > button to advance to the next page of the dialog.
The next page lets you sort, using up to four fields.
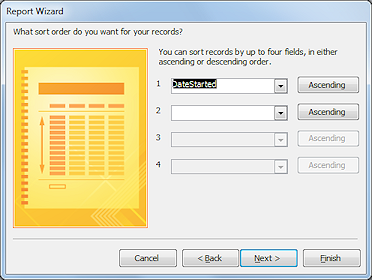 In the first sort box, select DateStarted.
The report will put the records in order by the date in the DateStarted field.-
Click on the Next > button to advance to the next page of the dialog.
There are several choices for the layout for the report. Which ones you see depends on the choice you made about grouping. Since we did not group for this report, there are three layouts.
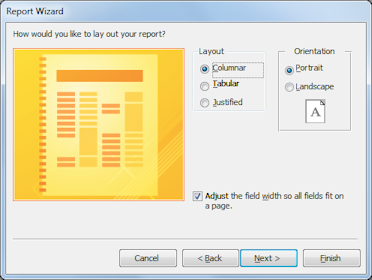
Click on the radio button for Columnar to select it.
This will put the controls into a single column.Leave the default orientation, Portrait, and the check mark in the box 'Adjust the field width so all fields fit on a page'.
-
Click on the Finish button.
Access now creates the report with the same name as the source table Trips, and opens it in Print Preview.If you had continued to the Next step in the wizard, you could have chosen a different name for the report before it was created.
- If necessary, click in the background beside the page to show the whole page.
- Save As, with a new name, Trips Report Wizard.
Access 2007: Office button > Save As > Save Object As Access 2010, 2013, 2016: File tab > Save Object As
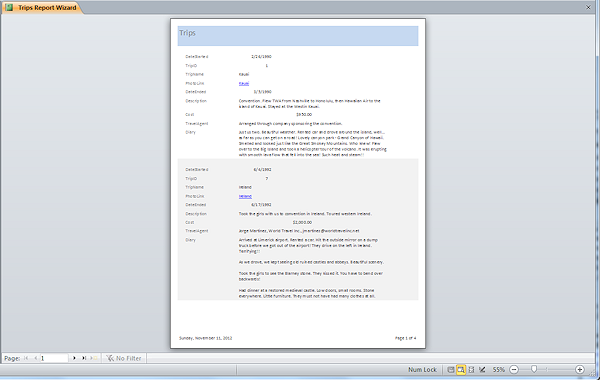
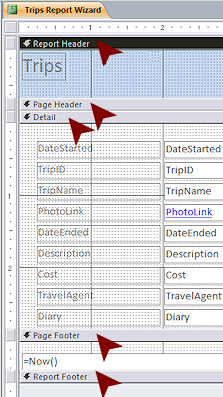
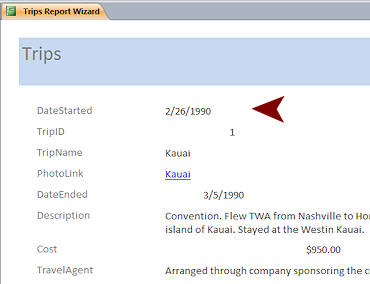
Report opens in Print Preview
Features of this report:
- Controls are in a single column and several stretch across the whole page.
- The page footer shows the current date and page number with total number of pages, like "Page 1 of 4".
- Records do not split between two pages.
That creates extra white space at the bottom of some pages. - Records have alternating background colors.
- Memo/Long Text fields expand as needed to show all of the text.
That means that some records use more space than others.
- If necessary, close the report Trips.
You now have two reports that are actually the same. They even show the same name on the tab in the Object window. That could be confusing! - In the Navigation pane, click on the report Trips.
This is the report that the Report Wizard created. - Press the DELETE key.
The report is deleted.
Print Preview: Navigate Pages
Print Preview shows one page at a time by default.
The Navigation bar and the navigation keys on your keyboard can all help you get around in the preview of your report. You cannot use the scroll bars or mouse wheel to change to pages that are not already in the display.
 In Print Preview of the report Trips Report Wizard, use each of the navigation buttons at the bottom of the preview
window to navigate through the report's pages.
In Print Preview of the report Trips Report Wizard, use each of the navigation buttons at the bottom of the preview
window to navigate through the report's pages. - Type in a page number and press the ENTER key.
(There are 4 pages in the report)
-
 Try the navigation keys:
arrow keys, Home, End, Page Up, Page DownThese keys move the page inside the window when the preview shows less than the whole page. (See next section about Zoom.)
If the whole page shows AND if the focus is not on the page itself, then the keys move you from page to page but the scroll wheel still will not.
 Problem: Navigation keys don't do anything.
You clicked with the mouse to zoom in and then to zoom back out. The focus is still on the page.
Solution: Click in a background area outside the page. The window shows the whole page. Press the navigation key you want to use.
- While you are navigating, inspect the fields for each record.
Problems appear!
The controls with short values, like Cost, TripID, TripName, and the dates are lining up oddly.Shortly we will move to Report Design View where you can fix that.
Print Preview: Zoom
Sometimes you need to see a whole page at a time. Sometimes you need the page to be large enough to read the text on the screen. Access lets you adjust the size to suit your task using the Zoom box or slider or by using the mouse.
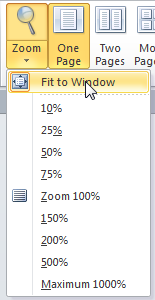 On
the Print Preview ribbon tab, open the Zoom list by clicking the down arrow.
On
the Print Preview ribbon tab, open the Zoom list by clicking the down arrow.
- If necessary, click on to Window.
The window now shows the whole page. The text will be very small! It is probably too small to read.
- Move your mouse over the image of the page.
The mouse pointer changes to the Zoom In shape (larger
text).
(larger
text).
-
Click on the page.
The size changes. The mouse pointer now has the Zoom Out shape (smaller
text).
(smaller
text).
Can you read the text now? That will depend on what Zoom size was used before.
- Experiment: Zoom
- Try all of the choices on the drop list for the Zoom button.
- Drag the Zoom slider on the right end of the Status Bar.


- Click the + and - buttons at the ends of the Zoom slider.
-
Click the % toggle button at the left of the Zoom slider.
- What percentage is Fit to Window on your monitor?
On my monitor, when Access is maximized, 75% is the same size as Fit to Window for a single page.
When you are ready to continue...
- Select 100% with the method of your choice.
Ah! Readable.
- Move the mouse pointer back over the page and click several times.
The page size toggles between Fit to Window and whatever Zoom size you used last.
Report Design View: Property Sheet
The report itself and each control, label, line, or section of the report has its own properties. Properties control the look and behavior of the object. The properties like OnLoad and OnFocus tell Access to do something when the event occurs. This might be to do a calculation or to show or hide another window or to refresh the data so that the latest data is showing.
So many choices can get VERY confusing. Happily, most of the properties can be left alone most of the time. Many of the properties that are frequently used can be set with buttons on the Report Design Tools ribbon tab.
-
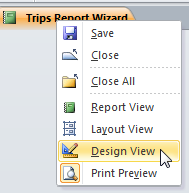
 Right click on the title tab for the report and select Design View.
The Design View opens.The Detail section shows the controls for a record. All records use the same controls. In Design View you cannot see the actual data like you did in Layout View.
 Point of Confusion: The identifying text in the controls is neatly aligned to the left, but the data may not have this alignment.
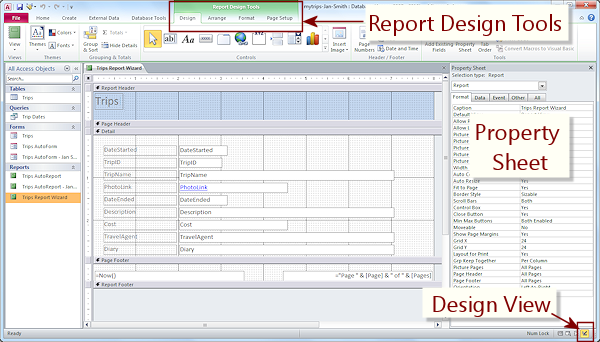
 The Status Bar icon has a highlighted icon for the current view. The Property Sheet automatically opened to show the properties of the report itself. Notice that the top of the property sheet shows "Selection type: Report" and the drop list shows "Report". So the properties that you see are for the report as a whole.
 -
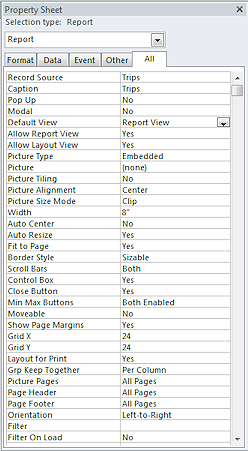
If necessary, click on the All tab in the Property Sheet.
The other tabs show a subset of these properties to help you find properties quickly. The list of properties on the All tab is very long and it is not alphabetized.Problem:
Properties Sheet is not visible

 Solution: Click on the
Property Sheet button on the Report Design Tools: Design ribbon tab.
Solution: Click on the
Property Sheet button on the Report Design Tools: Design ribbon tab.
-
Scroll the list to see all of the properties that you can control.
Some may not make sense yet. Some are not often changed.
-
 Click on several entries and check out what choices you have.
Most properties show a down arrow which opens a list of choices. Some have an ellipsis button (3 dots) which opens a dialog. Some require you to type a value like a size.
Look at the left end of the Status Bar for a message about the current property.
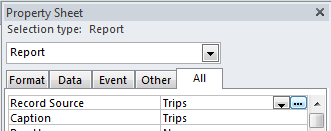
 Record Source is where the data is coming from. You only see the name, not whether it is a table or a query. This is one reason why you need a method of naming your objects that makes it clear what kind of object it is. Caption is what shows on the tab as the title. It does not have to be the same as what shows on the report itself.
 - Experiment: Properties
-
 Click in the Design area on the Report Header bar.
The bar 'Report Header' turns black and that whole section of the report is selected. This section contains only the label, Trips Report Wizard.
-
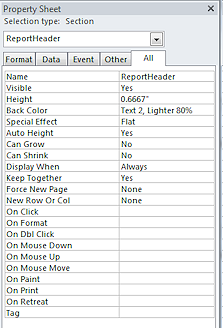
Inspect the Property Sheet which shows the Selection type is 'Section' and the drop list shows 'ReportHeader'.
There are a lot fewer properties than the report itself had. - Click in the Back Color property in the Property Sheet.
A down arrow button and an ellipsis button appear at the right.
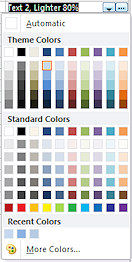
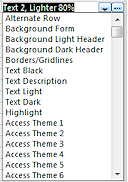 Click the arrow button and inspect the list of colors.
 - Click the ellipsis button.
The normal Office palette opens, showing theme colors and standard colors. The current color is a theme color, Text 2, Lighter 80%. If you apply a different theme to the database, this report will automatically use the color for the report header background. - Try out some of the colors in the list and from the palette.
Do you find any that you like better than the Office theme color? The 'System' colors at the bottom of the drop list are colors that Windows itself is using for various dialogs and windows. -
Similarly, select and inspect the properties for other sections of the report.
The Page Header and Report Footer will not show in this report. The Height property is set to 0" for these sections. No space shows in the Design area for these two sections.
- Click in turn on various labels and controls in the Detail view.
The Property Sheet changes to show the properties of the currently selected item. - Inspect the Property Sheet as you go along.
- Select the Diary control.
This control is for a Memo/Long Text type field.
-
Find the Can Grow property.
The Property is on the All tab and also on the Format tab. Look toward the end of the list in the ALL tab. It is 6th from the bottom on the Format tab, which is a much shorter list than the All tab shows.
The Can Grow property is set to Yes, which allows this control to expand automatically for records that have a lot of text in this field. Sweet feature! It's just a bit hard to find in the list. The Report Wizard was pretty smart to set this feature for you.
-
Report Design View: Edit Controls with Ribbon
The text and numbers in several controls are not lining up neatly with the others. The problem is not with the control itself but with the alignment of the contents of the control. Most numbers, including currency, are right aligned by default. But text is left aligned by default. So, for example, the amount in the Cost control is stuck over at the right edge of its text box. We can use the Property Sheet or the ribbon buttons to adjust the alignment in the box and/or the size of the control to get a better looking result.
You can make some changes directly in the Design View but other changes can only be made in the Property Sheet.
-
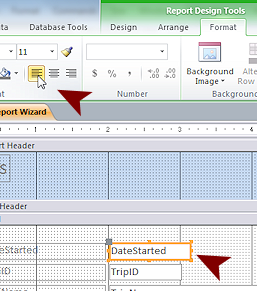 In the Design area, click the control DateStarted to select it.
 - On the ribbon tab Report Design Tools: Format, click the Left Align button
 .
.
Nothing seems to change.
 Switch to Report View.
The DateStarted is now aligned at the left.- Switch back to Design View.
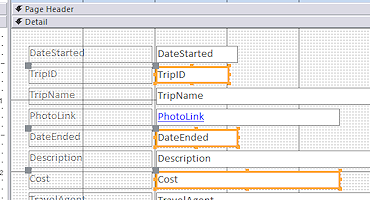 Click on the control for TripID, hold down the SHIFT key and click on DateEnded and Cost, then release the keys.
All three controls are selected.- Click the Left Align button again.
-
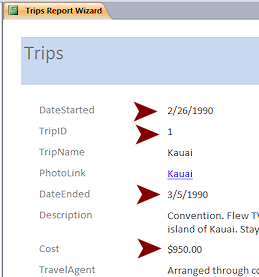 Switch to Report View.
All four controls with number values are now aligned to the left. - Click on the Save button


 in the Quick Access Toolbar or use the key combo CTRL + S.
Your changes to the report are saved.
[Trips Report Wizard]
|
|
| © 1997-2017 Jan Smith All Rights Reserved |
Site Map What's New |
Privacy Policy Terms of Service Copyright Acknowledgements |
~~ 1 Cor. 10:31 ...whatever you do, do it all for the glory of God. ~~
Last updated: March 22, 2017