
Jan's Working with Databases
Forms & Reports: Reports: Calculated Totals
You need a different technique to create totals based on calculated controls. If you try the simple method from the previous lesson, Access pops up a parameter dialog asking for a value for the calculated control that you are trying to total. This kind of glitch can drive you crazy when you don't know where the problem is coming from!
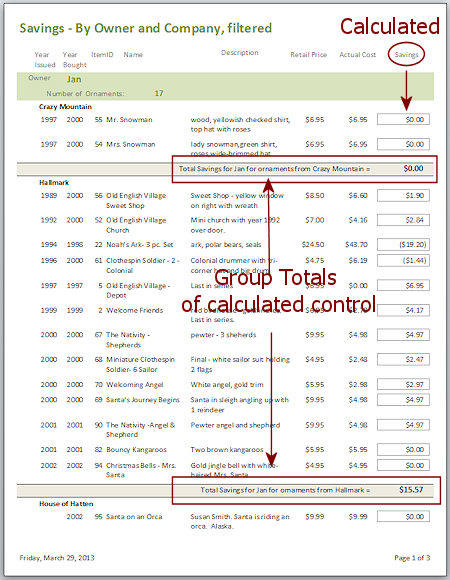
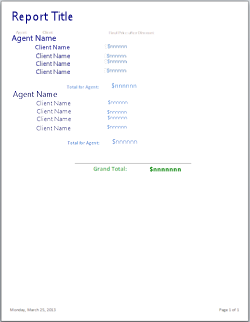
Example: Report with calculated control Savings in Detail section.
Totals over each group. Savings = [Retail Price] - [Actual Cost]
Using data from Christmas Ornaments database
Totals for Calculated Values
You cannot use the simple method from the previous lesson for totaling values that come from a calculated control. There are ways, however, to get around this limitation!
Method 1: Repeat the calculation in the control source for the total
(Can not use an
aggregate function in the calculation, like Sum, Avg, Max, or Min.)
-
You have a calculated control in Detail section:
The control source is an expression that calculates the control's value. The calculation does NOT use an aggregate function (Sum, Avg, Count, Max, Min, etc.).In the example report, the control named Savings is in the Detail section and is calculated with the expression =[Retail Price]-[Actual Cost] The fields Retail Price and Actual Cost must be in the Report Source, of course. In this example the record source is a query which filters the records.
- To hold the total, create an unbound text box control in a header
or footer:
As control source, use an expression that performs the total and repeats the calculation instead of using the name of the calculated control, like
=Sum([Retail Price]-[Actual Price]) instead of =Sum([Savings])
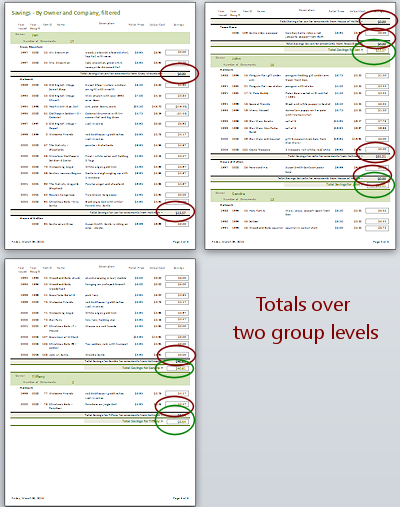
In the example this expression is used for two controls, one in each group footer. The ornaments are grouped by Whose (which family member owns the ornament)and then by Company (who made the ornament).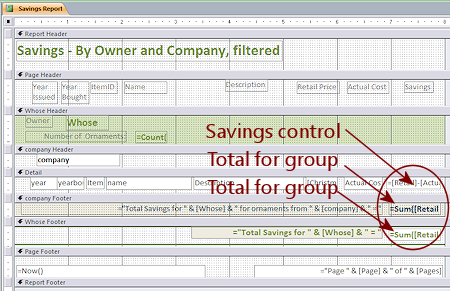
Other aggregate expressions would also work, like
=Max([Retail Price]-[Actual Price]) or
=Avg([Retail Price]-[Actual Price])Error: Parameter dialog appears
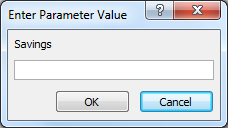 It seems logical to use the
expression =Sum([Savings]) to total the Savings values. This syntax worked to total the fields Retail Price and Actual
Cost. However, if you try it with Savings, a parameter dialog
will ask you to
enter a value for Savings. Since Savings was a calculated control, Access cannot see its value to put in a
header or footer.
It seems logical to use the
expression =Sum([Savings]) to total the Savings values. This syntax worked to total the fields Retail Price and Actual
Cost. However, if you try it with Savings, a parameter dialog
will ask you to
enter a value for Savings. Since Savings was a calculated control, Access cannot see its value to put in a
header or footer.
Method 2: Calculate field in query
-
Make the report's source a query which includes a calculated field.
In the example you could add a column to the source query like:
Difference:[Retail Price]-[Actual Price]
- Create a control in a header or footer for the total based on the
calculated field.
Like =Sum([Difference]) or =Max([Difference])
Method 3: SUM by collecting a running sum
(Can use an aggregate function in the calculated control)
This method is required when the calculation includes an aggregate function (Sum, Avg, Max, Min, etc.) but will also work for simpler calculations. A Running Sum adds up the values. (Duh!) There is no way to do a running average, or any other aggregate function. Just adding up the calculated values.
- Create a calculated control in a Detail, Group Header, or Group
Footer section:
The control source can use a field name or an expression to calculate the control's value.
The expression is allowed to use an aggregate function.
Examples:
=[Savings]
=[Retail Price]-[Actual Price]
=Sum([Retail Price]-[Actual Price])
=Avg([Retail Price])
=Max([Retail Price])
=Max([Retail Price]-[Actual Price])
- Set the Running Sum property for the control to Over Group or Over All.
Now the control will show an accumulating total.
- For Grand Total: If the Running Sum is set to Over All, then you
can repeat the final total in the Report Footer or Header.
- Create an unbound text box control in the Report Header or Footer.
- Set its control source to be the name of the control
accumulating the running sum.
Example:
If the control RunSumSavings is collecting a running sum, then the control in the Report Footer would have =[RunSumSavings] as its control source. This control will repeat the last value of the running sum, which would be the final total.
 To see both Running Sum and
current value:
To see both Running Sum and
current value:
Use two controls. One with Running Sum = No to show the record's value and one with Running Sum = Over Group or Over All.Invisible control: If all you
want to see is a grand total for the group or report, you don't need to
see the accumulating values for each record. Set the Visible property
for the control in the Detail section to No.
You can make the control width teeny tiny if you need the space for other controls.
Method 4: Create a function - If you used VBA code to calculate a
control's value, you must create your own function to get a total.
Example from Microsoft![]()
![]() Problem:
Totals are not accumulating as expected
Problem:
Totals are not accumulating as expected
- Check the Table Design View to see if your numbers are actually Text Data Type instead of Number or Currency type.
- Check the order of your choices in the Group, Sort, and Total pane.
- Check that you are totaling the correct control. (Spelling counts!)
| |
Step-by-Step: Totals with Calculated Values |
|
| What you will learn: | to plan the report first to use Query Builder to create a Record Source to add controls and labels to create a group and edit the layout to create a calculated control to create a total of calculated values for group and whole report with: Method 1: Repeating calculation in Total control Method 2: Query with calculated field Method 3: Running Sum property |
Start with: ![]() , resource files, worldtravel-Lastname-Firstname.accdb from folder databases project4 as updated in the previous lesson
, resource files, worldtravel-Lastname-Firstname.accdb from folder databases project4 as updated in the previous lesson
Plan Report
You will create a report that shows the total price of the trips sold by each travel agent, after including any discounts that were applied. The discount is a complicating factor. The Trips table has a Price field and a DiscountID field but does not have a field for the cost of the trip after taking the discount. In Access 2010, 2013, and 2016 you could have a calculated field in the table design for this CostAfterDiscount.
The Summary Options in the Report Wizard can only use fields from a table. The Group, Sort, and Total pane cannot see anything but fields in the table either. But there is a way!
You will create a new query to use as the Report Source for the report. We will do this in stages. If you get complicated to start with and there are errors, it is difficult to figure out what is causing the problems.
The query must contain the fields that you want to show on the report and any fields that you need to group or sort the records. It can also contain calculated values.
Plan the report's organization before designing the query:
The report is going show the final cost of the trips sold by each travel agent and also a total for each agent. You will need to show at least the agent's name and the final cost of the trip. For this report we will show the client's name.
For this first attempt, we will not try to calculate anything in the query itself.
Where is the information that you need?
The Trips table for sure! But that table has only ID numbers for the agent and the client and the discount. So you need to add tables/queries that have the names (Staff and Clients), the original price (Trips), and the discount percentages (Discount). These tables already have relationships, so Access can match up records from the different tables neatly. You won't have to add all of the fields to the query grid. Another benefit of a relational database!
What fields do you need for grouping and sorting?
You will group the records by agent name and sort the agents and clients alphabetically.
Use Query Builder to Create Record Source
You can create a query that is saved as part of the report using Query Builder, which looks almost exactly like Query Design View. Such a query cannot be used by another report or form since it does not show in the Navigation Pane. This also means that it cannot be messed up because you made changes to the query for a different purpose. This is a BIG advantage of using Query Builder.
- On the Create ribbon tab, click the Report Design button
 .
.
 A blank report opens in Design View.
 - If necessary, show the Property Sheet.
 Click in the Record Source property and then click the ellipsis button
  at the right of the property.
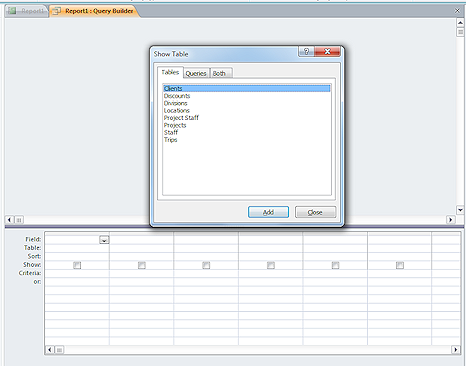
The Query Builder opens with the Show Table dialog open.- Add the tables Clients, Discounts, Staff, and Trips.
-
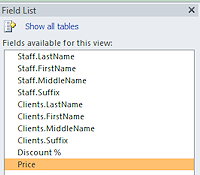
Add the following fields in this order:
Staff: LastName, FirstName, MiddleName, Suffix
Clients: LastName, FirstName, MiddleName, Suffix
Discounts: Discount %
Trips: Price
-
Sort Ascending the LastName, FirstName, MiddleName columns for the names from the Staff table first and then the Clients table.
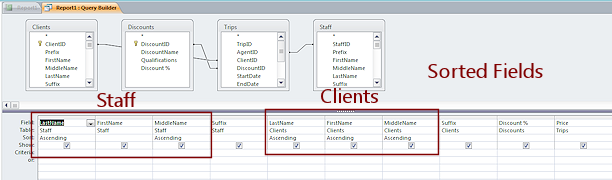
The order of the columns is important! But there can be other columns in between the ones that are sorted.
Below the field name in the grid is the name of the table that the field is in. When field names are duplicated in different tables, you must be very careful!
-
 Run the query and check the alphabetizing.
The agents are in alphabetical order. Each agent's clients are in alphabetical order.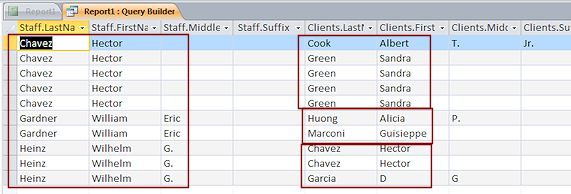
-
Click the Close button
 on the ribbon tab.
A message appears that asks if you want to save changes to the SQL and update the property.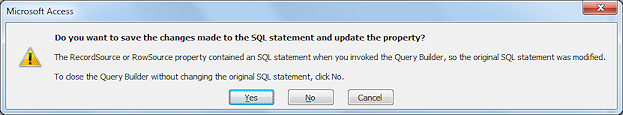
The property is RecordSource. So, this just means saving your changes and updating the report to use the new query.
Click on Yes.
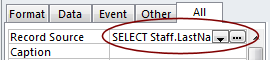
You are back in Design View with an SQL expression in the Record Source property.The report is still blank.
-
 Save the report as Trips by Agents.
Add Controls and Labels
Now you can add fields to the report's Design View.
- In Design View, open the Field List.
(Report Design Tools: Design > Add Existing Fields) -
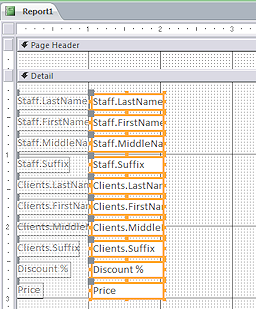
 Drag all of the fields to the Detail section.
They neatly line up vertically.The controls for duplicated field names include the table name with a period between the table and field names. This is the only way Access can keep track of what goes where.
-
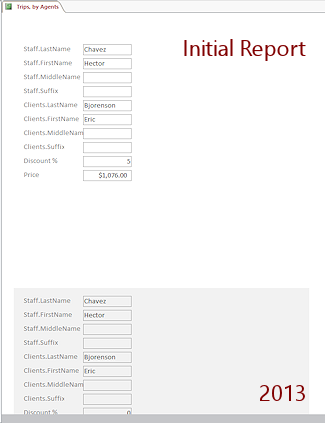
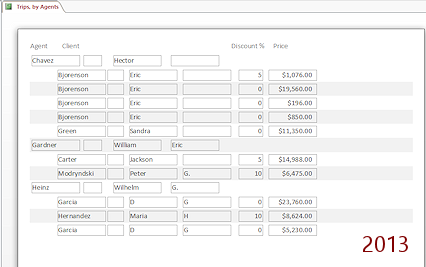
 Switch to Report View and scroll to see how this initial version of the report looks.
 Access 2010, 2013, and 2016 look just alike. In Access 2007 the controls do not have borders.
-
Check the alphabetizing.
That is working, but the rest is not good at all!The names are hard to read when separated into separate controls like this.
The layout wastes a lot of space to the right and below the record controls. That bottom space is easy to fix!
- Switch to Design View.
-
Drag the bottom edge of the Detail section up below the last control, Price.
-
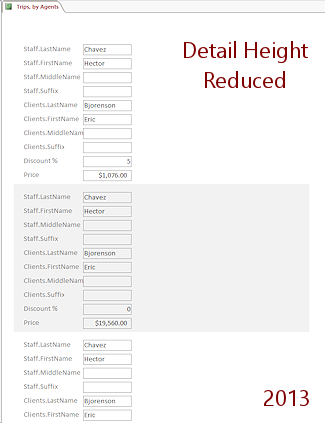 Switch to Report View.
That fixed one space issue.Next you will change the layout of controls to use the blank horizontal space.
-
Save.
[Trips by Agents]
Create Group; Revise Layout
Next you will create the group on the agent's name and rearrange the report.
- Switch to Design View.
- Open the pane Group, Sort, and Total.
 (Report Design Tools: Design > Group & Sort)
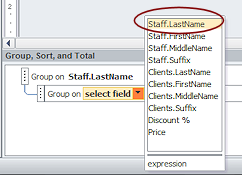
 - Click the Add a group button.
- Choose the field Staff.LastName.
A blank group header section appears, titled Staff.LastName.
This grouping will only work well if there are no agents with the same last name! - Change the Width property of the report to 8".
-
Drag the control Staff.LastName to the group header.
The label and control move together.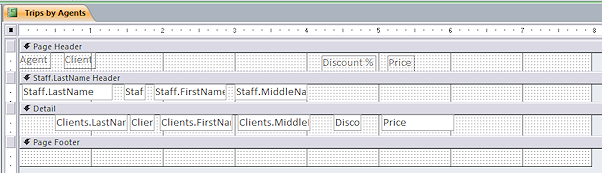
- Cut and paste the label for Staff.LastName to the Page Header.
The pasted object always pastes to the top left of the section.
(If you try to drag it, you get both the label and its control or neither.) - Similarly, cut and paste the labels for Clients.LastName, Discount %, and Price to the Page Header.
Move the pasted labels to the positions in the illustration. - Edit the first two labels in the Page Header to read Agent and Client.
- Delete the remaining control labels in the Detail section.
- Drag the controls for the staff name to make a row in the group header, as in the illustration.
- Resize the Staff.Suffix control.
- Drag the other controls to line up in a row in the Detail section, similar to the illustration.
- Resize the Clients.Suffix control and the Discount % control.
- Drag the bottom edge of the Detail section up just below the row of controls.
-
 Switch to Report View.
Access 2007 still does not show borders on the controls. - Verify:
- Records are grouped on the agent.
- Controls are wide enough to show all of the values.
- Switch to Design View.
- Add Title:
-
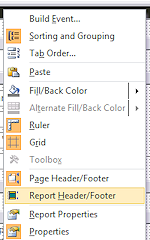 Right click on a section bar and in the context menu click on Report Header/Footer.
 A blank Report Header and Report Footer appear.
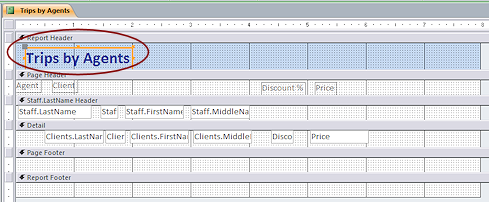 Add a Label to the Report Header and type Trips by Agents in it.
- Format the new title as:
Bold, 20, Dark Blue (from the Standard Colors section of the palette). - Resize the title label to Best Fit.
The control gets taller and wider. The header automatically enlarges to hold the new height.
-
- Save the report.
[Trips by Agents]
Add Calculated Control for Final Price
Now that you have the report under better control, you can add a control that will calculate the price of the trips after any discount.
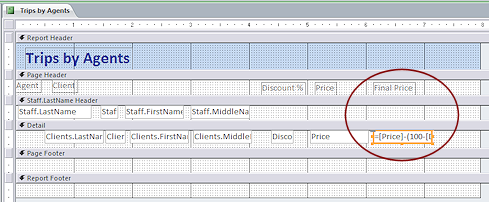 To the right of the Price control, add a text box.
- Cut and Paste the label for the new control to the Page Header, lined up with the new unbound control in the Detail.
- Edit the Name of the control and the Caption property of its label to both read Final Price.
- Enter the following expression as the Record Source for the new control to calculate the price after discount:
=[Price]*(100-[Discount %])/100We want to show the price after taking off the discount. What we have is the original price and the percentage discount, not the dollar amount of the discount. There are several expressions that will give the same result. This one has simple syntax. It could be much more complex. Really!
How this expression works:
- Square brackets surround a field name.
- Parentheses group terms together.
- The order of operations rules from algebra apply to expressions.
Operations inside parentheses are calculated first. So the subtraction happens first.
Then the multiplication and then the division since equal level operations are done from left to right. - The Discount % was recorded in the Discount table as a number, like 5, 10, or 8 instead of the decimal form, like 0.05, 0.10, or 0.08. So the expression first calculates the percentage after discount, 100-[Discount %]. But the value is not a decimal so we must divide by 100.
- Set its Format property to Currency.
-
 Access 2007:
- Change Report Header Back Color to Access Theme 4.
- Change the group header Back Color to Access Theme 2.
- Select the controls in the group header and set their Back Style to Transparent.
Otherwise the control will have a white background on top of the section's colored background.
-


 Access 2010, 2013, 2016: Remove Borders
- Select the controls in the group header and the Detail section.
- Set the Border Style property to Transparent.
- Access 2010, 2013, 2016: Remove Alternating Colors:
- Select the group header and set Back Color and Alternate Back Color to Access Theme 1.
- Select the controls in the group header and set Back Style to Transparent.
Otherwise the controls will have a white background on top of the section's blue background.
- Select the Detail section and set its Alternate Back Color to No Color.
 Save the report.
[Trips by Agents]-
Switch to to Report View.
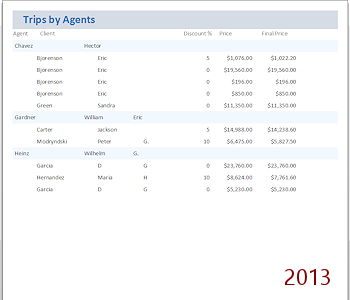
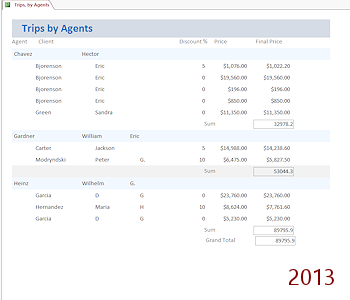
Your report shows the discount percentage, the trip's price, and calculates the Final Price. Notice that not everyone got a discount.Now you are ready to add some totals, which is the whole point of this report.
Total the Final Price: Two logical methods fail!
First, try using the Group, Sort, and Total pane again to get group and report totals for Final Price.
Method: Add Total From Group Pane
- Switch to Design View.
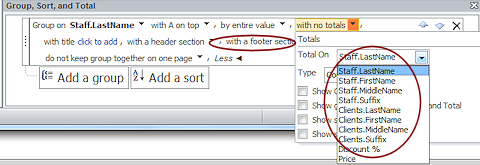 Expand the list of properties for Group on Staff.LastName by clicking the More button.
- Change the footer property to 'with a footer section'.
-
Expand the list of fields for Total On.
The new calculated control Final Price is not there!
FAILED METHOD: You cannot use the Group, Sort, and Total pane to total a calculated control.
Let's try adding the total control manually.
Method: Add Total Control Manually
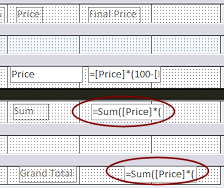
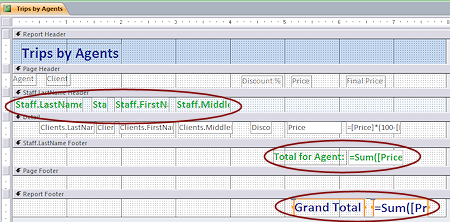
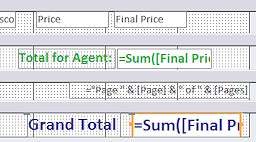
![Design View: added total manually to group footer and report footer, =sum([Final Price]) (Access 2010)](tripsbyagents-design-total-sumfinalprice-2010.png) Add new text boxes to the group footer and the report footer.
Add new text boxes to the group footer and the report footer.- Set the Format property to Currency for both.
- Edit the Control Source to be the following expression for both controls:
=Sum([Final Price]) - Edit the labels to read Sum for the group footer and Grand Total for the report footer.
-
 Switch to to Report View.
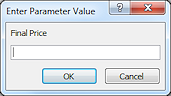
Whoops. A parameter dialog appears asking you to enter a value for Final Price. That means that Access does not see a field with that name. That's right! It is a calculated control. Access cannot do the calculation you want this way.
-
Click on Cancel.
You are back in Design View.
FAILED METHOD: You cannot total a calculated control on the report.
Method 1: Totals with Expression that Repeats Calculation
Instead of asking Access to do a Sum with the calculated control, you can tell it what the calculation is, right in the expression for the control.
 Edit the expression in each of the two total controls by replacing [Final Price] in the expression with the calculation from the Final Price control:
Old expression: =Sum([Final Price])
New expression: =Sum([Price]*(100-[Discount %])/100)
Tip: You can carefully copy and paste the calculation part from the Final Price control.
In fact, you can copy and paste from this web page to the control. Be careful to remove ALL of the existing expression before you paste.
Read the expression and notice what goes where!
-
 Switch to to Report View.
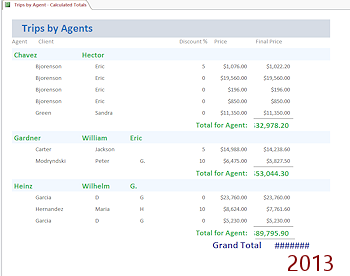
In Access 2010, 2013, and 2016 the group footer has a background color. Some formatting and some lines could help make the totals easier to see. Problem: #Error for Grand Total

You placed the control in the Page Footer instead of the Report Footer.
Solution: Move the control to the Report Footer. - Switch to Design View.
-
Access 2010, 2013, 2016: Select the group footer and change its Alternate Back Color to No Color.
That will remove the gray background.
-
 Add a dividing line above the control for the total in the group footer and above the total in the report footer.
Line width: The default width is 1" for a line and for a control. So the default size is OK for now.
- While the line is still selected, move the line to center it over the control and get it to the top of the section.
That's easiest to do with the arrow keys.
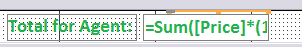
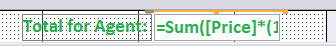
Once positioned at the top of the section, when the line is not selected, you won't see it in Design View. It's hiding in plain sight but it's too thin to see. - Edit the label in the group footer to read Total for Agent:
- Format the group total and label and the controls in the group header as:
Currency, Bold, 14 pt., Green, Border Style = Transparent. Resize with Best Fit to adjust the heights of the controls.
- Move the label in the group footer to the left so that it does not overlap the total.
- Format the report total and its label as:
Currency, Bold, 18 pt, Dark Blue, Border Style = Transparent, and resize as Best Fit. - Arrange and size the controls and labels similar to the illustration.
The horizontal lines you added won't show in Design View if they are at the very top of the section. - Save As Trips by Agent - Calculated Totals.
 Switch to Report View.
Check for data that is cut off. If a number does not fit into the space, the digits are replaced with hash tags, like #####.You must make some adjustments. The controls for the totals need to be wider. Best Fit for controls will change the height hold the current font size but won't change the width. Access does not know what the values are until they are calculated.
- Switch to Design View.
- Change the Width property of the group total to 1.3".
-
 Select the line above the control.
Selecting this line can be tough. Drag from the right side of the total control to the left and up. You will likely select both the line and the control. Hold the SHIFT key down and click on the control to deselect it.Alternate method: Select from the drop list. The line will have a name like Line18. The first line is the group footer line and the second one is the report footer line (if you created these according to the directions).
- Change the Width property of the line to 1.4".
 Click on the line again to move the focus out of the Property Sheet.
Use the arrow keys to move the line horizontally to center it over the control.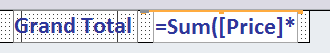 Change the Width of the grand total control in the report footer to 1.5".
Move the control, its label, and the line to the left if the report got wider than 8". Then reduce the report width back to 8".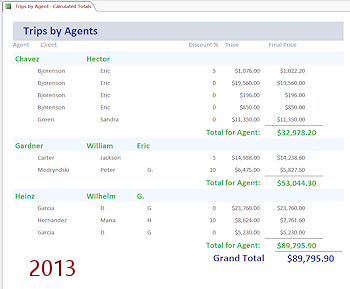 Change the Width of the line above the control to 1.6" and center it over the control.
Move the control, its label, and the line to the left if the report got wider than 8". Then reduce the report width back to 8".- Switch to Report View.
Inspect the report carefully. Make note of any errors. - Switch to Design View.
- If the report width enlarged when you made something wider, drag the right edge of the report back to the 8" grid line.
If you cannot get the report back to 8", a control is in the way, probably one of those lines that are hard to see. - Make any corrections in Design View so that your report shows all of the data in the controls and the totals line up neatly with the record values. The totals controls had to be enlarged because the font size was increased. That means that the dividing lines had to be longer.
Design choices make it easy to see:
- Which total goes with which agent
- That group totals are not record values.
- That the report total is not a group total or a record value.
- Where one group stops and the next begins.
What's still missing?
-
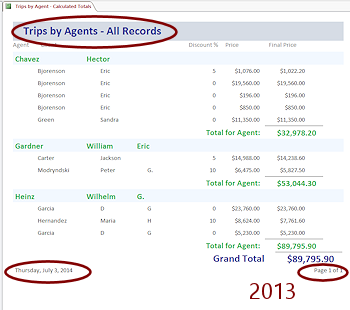
Time period covered by the report!
When you plan to run a report at different times, you need to show what time period the report covers. Even a one-time report probably needs the time period stated somewhere.In this case, the report includes all records in the database.
- Date/time report was run.
- Page numbers, if the report gets longer.
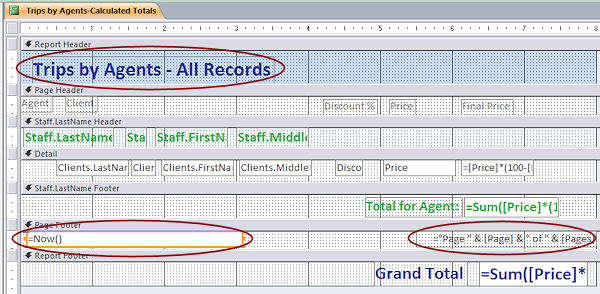
- Edit the title in the Report Header to read Trips by Agents - All Records.
- Add Date/Time:
- If necessary, drag the bottom of the Page Footer section down about 0.25".
- Add to the Page Footer a text box control that is 3" wide.
- Delete the label for the control.
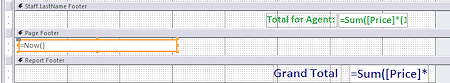 Type as the Control Source the expression =Now()
- Align the text Left.
- Change the Format property to Long Date.
- Change the Border Style to Transparent.
- Drag the control to the left edge of the report.
- Add Page Numbers:
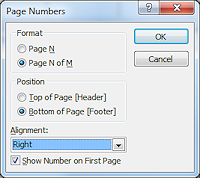 On the ribbon tab Report Design Tools: Design, click the button Page Numbers.
The Page Number dialog opens.- Choose Page N of M, Bottom of Page [Footer], Alignment Right, check the box for 'Show Number on First Page'.
- Click on OK.
- Set the text alignment to Right.
This puts the page numbering at the far right of the control. - If necessary, align Top the controls in the Page Footer.
- Resize the height of the Page Footer to it minimum height for the controls.
 Save.
Save.
[Trips by Agent - Calculated Totals]-
Switch to Report View.
Notice how a short expression =Now() returned a long date and a long expression returned a short "Page 1 of 1".
Pages in Report View: You will ALWAYS see Page 1 of 1 when in Report View, no matter how many pages it will really take to print.
Method 2: Total of Field Calculated in Query
Doing calculations with the report's query is usually faster than doing them in a control as the report is formatted. Have you noticed a time lag when displaying the report before the totals show? The calculated controls are calculated after the formatting is done. The more records there are and the more calculated controls there are in the report, the more important it is to consider such speed issues.
You will now revise the report to calculate the Final Price in the source query.
- Switch to Report Design View.
- Save the report as Trips by Agent - Query Totals.
- Select the whole report from the drop list in the Properties pane or by clicking the Select button at the intersection of the horizontal and vertical rulers.
- In the Record Source in the report's Property Sheet, open the Query Builder with the ellipsis button .
- In the first blank column, define a new field:
Final Price:[Price]*(100-[Discount %])/100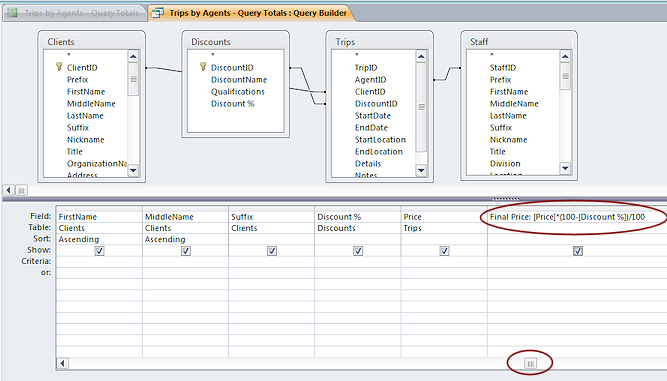
-
Run the query to be sure it works.
The datasheet looks good.
Problem: Only 10 of the 11 trips show in the datasheet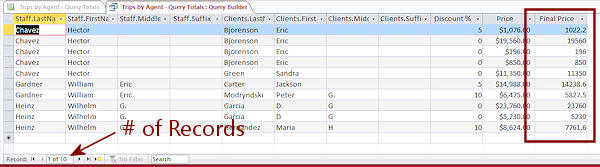
You did not revise the record in the Trips table earlier that had the default value for the ClientID. The joins between tables for this query require that there be values on both sides of the join. That may or may not be what you want to happen.
Solution: There are two easy fixes, depending on what you want to see. You can change the join to show the trip anyway, or (better) you can open the Trips table and enter a ClientID. But, with the Query Builder window open, you cannot open another Access object to edit the data. You will have to wait to fix this.
-
Close the Query Builder window and save the changes when prompted.
The query is saved as part of the report's design. It will not show in the Navigation pane.
-
 Edit the control Final Price in the Detail section to use the new field Final Price as its control source.
- Edit the two totals that used the calculation to
use the simple expression
=Sum([Final Price])
 Switch to Print Preview.
Success! The report shows the same numbers as before! With so few records, you certainly would not notice a difference in the time to format the report, but with many records, using the query would make a difference.
- Save the report.
[Trips by Agent - Query Totals]
Now you can fix the glitch in the records.
Method 3: Total of Calculated Value (with Running Sum)
There are times when you would like to see the total as it accumulates and not just a final total. That is done using the Running Sum property, but it only works for SUM, not for averages, maximum, minimum, etc.
- Switch to Report Design View.
-
Save the report as Trips by Agent - Cumulative
Totals
-
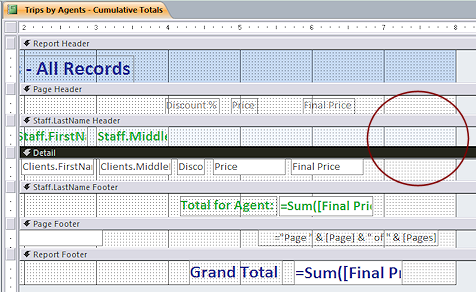 Move the label and controls closer together and over to the left so that there is room for a new control and label to the right of Final Price.
Don't forget the dividing lines!
- Add a control to the right of Final Price.
- Move the new label to the Page Header and change the text to Cumulative Total
- Change the Name property of the new control to CumTotal.
- Set the control source for CumTotal to =[Final Price]
- Change the Running Sum property for CumTotal to Over Group.
- Set the Format property to Currency.
-
Access 2010, 2013, 2016: Set the Border Style property to Transparent.
- Add a label to the Page Footer containing your name and center it around the 4" grid line.
-
Verify that your report is still 8" wide.
If it is not, fix it. You may need to move controls, labels, or lines first.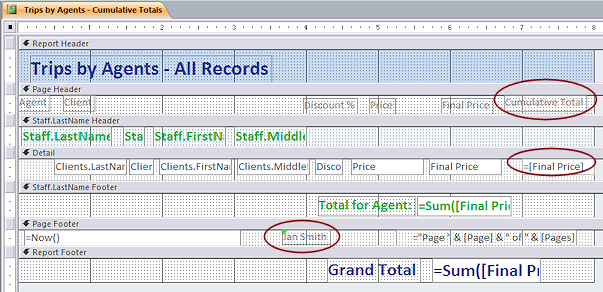
-
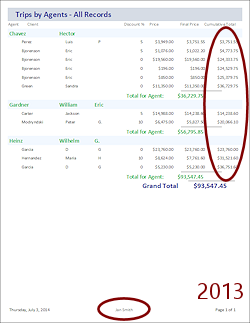 Switch to Print Preview.
The total accumulates in each group.
- Save the report
[Trips by Agent - Cumulative Totals]
 Print. (1 page)
For this lesson you created several versions of a report:
- Trips by Agents, which has no totals
- Trips by Agents - Calculated Totals, where each total control contains the expression to calculate what must be totaled
- Trips by Agents - Query Totals, where the calculations are done in a query which can then be totaled normally
- Trips by Agents - Cumulative Totals, where a total is collected as a running sum.
|
|
| © 1997-2017 Jan Smith All Rights Reserved |
Site Map What's New |
Privacy Policy Terms of Service Copyright Acknowledgements |
~~ 1 Cor. 10:31 ...whatever you do, do it all for the glory of God. ~~
Last updated: March 22, 2017
Fixing missing record, if necessary
Now the report shows a new record for a trip sold by Hector Chavez. The totals for Chavez and the report updated. Hurrah!