
Jan's Working with Databases
Forms & Reports: Reports: Simple Totals
Your report can show a number of different totals. A "total" can be any of the aggregate functions, including Sum, Avg, Max, Min, Count Records, Count Values, Standard Deviation, and Variance. So many choices!
 Total over what?
-
Whole report
- Each group
-
Running Sum in each record
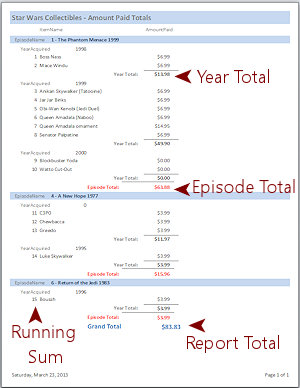
It is important to make it clear which total is which!
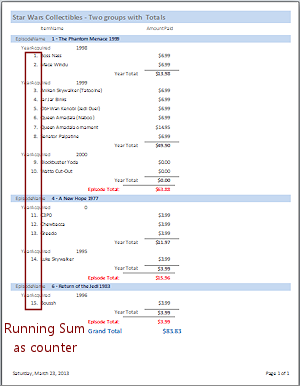
The illustration shows a report which has two groups, EpisodeID and YearAcquired. There is a group total for each, plus a grand total for the report. A running sum in the Detail section numbers the items over the whole report.
Note on Formatting of Calculations:
It is often important to make it clear in the report what parts are calculated. Most often you would use different formatting for the text/numbers or for the control.
Totals for Fields
Your report can easily show totals like sums, averages, and counts based on the fields in the report's source. You can total each group in a Group Header or Footer. You can total the whole report in the Report Header or Footer.
How to put a total in a report:
Method 1: Easy
- In the Group, Sort, and Total pane, select an entry.
- Click the More button.
- Click on the down arrow in the property 'with no totals' .
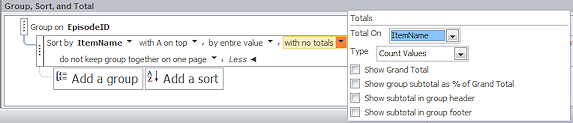
- Select the field you wish in the Total On list.
- Select the type of total you want.
- Check the box for Grand Total if you want one over the whole report.
- Check the box to show the group subtotal as a % of the grand total, if you wish.
- Select where you want subtotals to appear - group header or group footer, if you want them.
Method 2: When 'Easy' won't work
- Create an unbound text box control in a header or footer.
-
Set the control source for the new control to an expression that calculates the total that you want.
General Syntax: =Function([FieldName])
Examples: =Sum([Price]) or =Avg([Price]) or =Max([Price]) where the field named Price is in the report's source.
The field that you are totaling is usually shown in the Detail section but does not have to be.What will be totaled: Group or Report?
It depends on which section you put the new control. If it is in a group header or footer, then the total is over that group only. If it is in the report header or footer, then the total is for the whole report.
![]() Special Case: Counting
records with Count(*)
Special Case: Counting
records with Count(*)
For counting records, it is almost always better to use the expression =Count(*) instead of an expression based on a field name, like =Count([Price]).
The two expressions do not always produce exactly the same results. =Count([Price]) will not count
records that do not have a value in the Price field, but =Count(*) will! You almost always will want to count ALL records.
![]() Totals Per Page? The methods above will
not work to calculate totals for each page. Such a total cannot be calculated until after the report is
formatted for print. So, the page header and footer will not accept an
aggregate function like Sum or Avg or Count. It is possible to use Visual Basic code to
create page totals: Sample Code
Totals Per Page? The methods above will
not work to calculate totals for each page. Such a total cannot be calculated until after the report is
formatted for print. So, the page header and footer will not accept an
aggregate function like Sum or Avg or Count. It is possible to use Visual Basic code to
create page totals: Sample Code![]() from Allen Browne that you could adapt
from Allen Browne that you could adapt
Microsoft article ![]() for Access 2002 that you could adapt
for Access 2002 that you could adapt
Example: One Group Level with Sum
To sum the price paid for all the items in a group, you can use the Group, Sort, and Total pane.
 In the illustration
from the Star Wars Collectibles
In the illustration
from the Star Wars Collectibles![]() database, the records are grouped on the field EpisodeID. The total is the Sum on the AmountPaid field.
database, the records are grouped on the field EpisodeID. The total is the Sum on the AmountPaid field.
The control source for the new control is the expression =Sum([Amount Paid])
You can only pick a field that is in the report's source. The field is usually shown in the Detail section, as it is in this example, but it does not have to be in the report for the total to work!
The
report shows a total in the footer for each group and a grand total for the whole report.
Example: Two Group Levels with Sum & Grand Total
When you have two or more group levels, you can do totals for each group level. The report as a whole can also have a total. You do not have to use the same aggregate function for all of the totals.
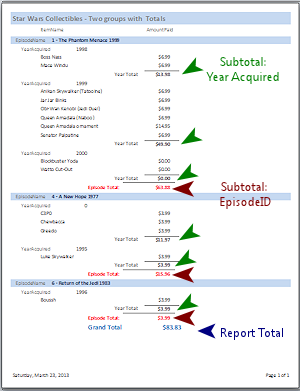
![]() Labeling: It is important that the totals are clearly labeled so
you can tell which total goes with which grouping. Staggering the totals
across the page usually helps. Formatting different levels differently
and/or using divider lines also helps.
Labeling: It is important that the totals are clearly labeled so
you can tell which total goes with which grouping. Staggering the totals
across the page usually helps. Formatting different levels differently
and/or using divider lines also helps.
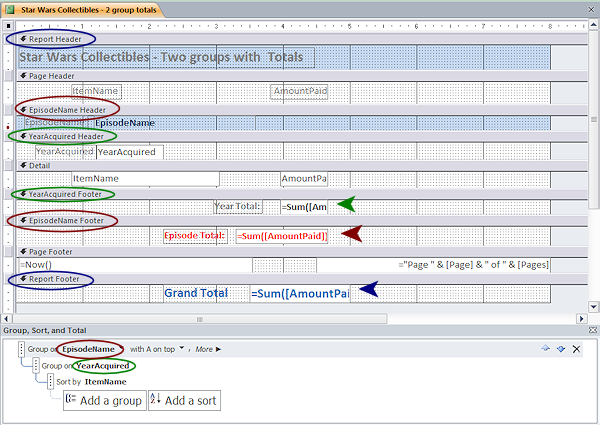
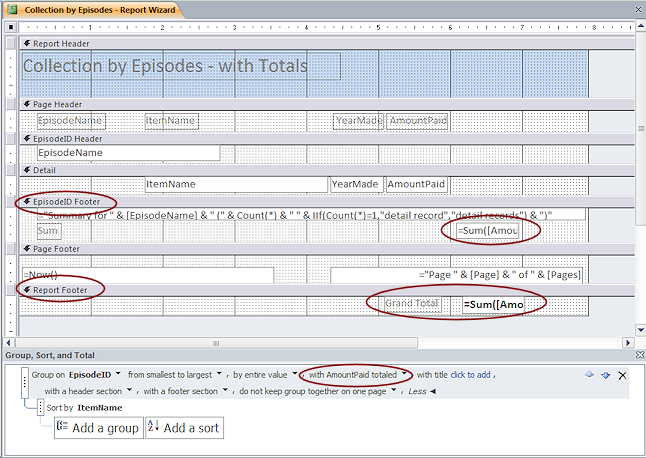
The Group, Sort, and Total pane shows two groups and one additional sort. The same calculation goes in each of the three controls for totals =Sum([Amount Paid]).
Access can figure out which records should be totaled for each subtotal. Group Headers/Footers are so helpful!
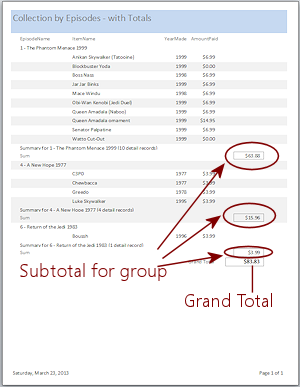
The report shows a subtotal for each group within each episode, a subtotal for each episode, and then a grand total for the whole report. The order of fields in the dialog is important!
Example: Running Sum
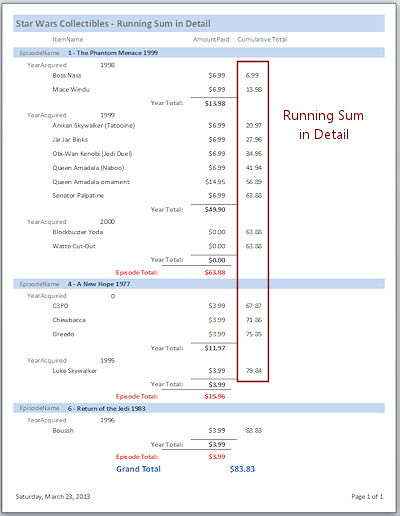 A running sum shows a total that increases with
each record or with each group. The illustration shows an accumulating total with each
record.
A running sum shows a total that increases with
each record or with each group. The illustration shows an accumulating total with each
record.
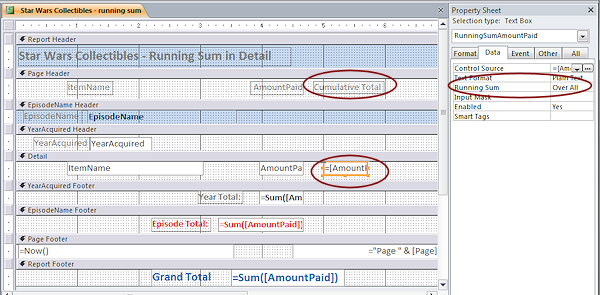
How to make the sum accumulate:
- Create the control you want to hold the cumulative sum.
- Set its control source to be the field you are accumulating, like =[Price] or =[Commission].
There may be another field with the same source! That's OK. - Set the property Running Sum for the control to either Over Group or Over All.
In the illustration, the field AmountPaid is used as the control source for two controls, which create the columns Amount Paid and Cumulative Total. The total is accumulating over the whole report.
The only difference between the two controls is that the Running Sum property is set to Over All for the Cumulative Total column.
![]() How to number each record with a
Running Sum:
How to number each record with a
Running Sum:
-
 Create an unbound text box control in Detail
- Set Control Source to =1.
-
Set Running Sum property to Over All to continue numbering in sequence for the whole report, as in the illustration.
Set Running Sum to Over Group to restart numbering with each group.
- Type a period (.) in the Format property to append a dot to each
number, as in the illustration.
| |
Step-by-Step: Totals - Simple |
|
| What you will learn: | to count records with the Count(*) function for groups and the whole report to use the Report Wizard to create a simple SUM for group and report to edit the report to create a running sum in the Detail section to number records with Running Sum |
Start with: ![]() , resource files worldtravel-Lastname-Firstname.accdb from folder databases project4 as updated in the previous lesson
, resource files worldtravel-Lastname-Firstname.accdb from folder databases project4 as updated in the previous lesson
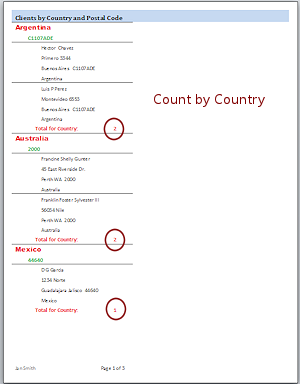
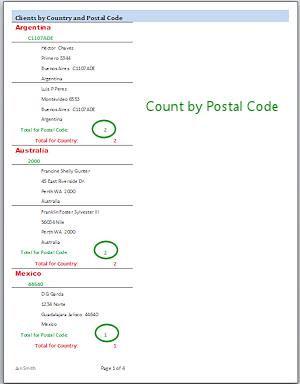
World Travel Inc. wants your report to show how many clients are in each country. For that you can add totals to your report that use the Count(*) function.
After finishing up the client report, you will create another report based on the Trips table and create some simple totals for it.
Count Records Using Function Count(*) for Group and Whole Report
The easiest way to count records is to use the special function Count(*).
You will create a new version of an existing report that groups the clients by country and postal code. You will add a total that uses the Count(*) function to count the number of records in each group and in the report as a whole.
 If necessary, open in Design View the report Clients - by country and postal code from the previous lesson.
 Save the report as Clients - country totals.
-
In the Group, Sort, and Total pane, change the PostalCode group to show a footer.
Country already is showing a footer.
By default the new footer will show alternating back color, which we do not want. - Select the PostalCode group footer and change its Alternate Back Color property to No Color.
-
Click on the Text Box button
 on the ribbon tab Report Design Tools: Design.
The pointer changes to the text box shape .
.
-
Click in the Country footer at about the 2" mark.
-
Type in the label for the new control: Total for Country:
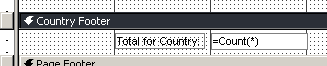 In the new control, type =Count(*)
Alternate method: Type in the Control Source property in the Property sheet.
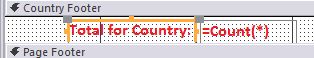
- Format the new label:
Font Size = 12
Bold
Color = Red
-
 With the label selected, click on the Format
Painter button
With the label selected, click on the Format
Painter button  .
.
- Click on the text box in the Country Footer.
The formatting of the label is applied
- Resize the label to AutoFit.
- Arrange the label and text box around the 2"
grid line.
 Switch to Print Preview.
Each Country group now has a count total. Point of Confusion:
Alignment
Point of Confusion:
Alignment
The total's text box in Design View looks like it is aligned to the left. But the total values are numbers, which are aligned by default at the right. In the Design View you see an expression, which is text. Text is aligned by default to the left. Confusing!
- Switch to Report Design View.
-
 Similarly, add a total to the PostalCode footer that counts the number of records in each
group.
Similarly, add a total to the PostalCode footer that counts the number of records in each
group.
You may need to drag the bottom edge of the footer down to make space for the new control.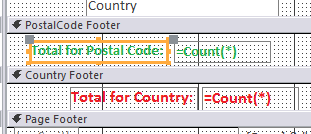
- Format this new total to coordinate with the PostalCode header:
Font Size = 11
Bold
Font Color = Green - Switch to Print Preview and check the new look on ALL pages.
- Switch to Report Design View.
-
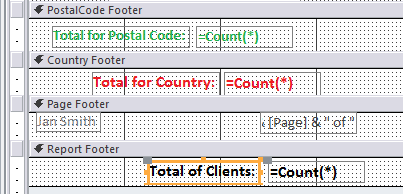 Add a new text box to the Report Footer.
You may need to drag the bottom edge of the footer down to make space for the new control. - Edit the label to read:
Total of Clients:
- Edit the text box source to read:
=Count(*)
- Format the control and its label as:
Font Size = 12
Bold
Font Color = Black
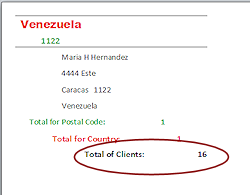 Switch to Print Preview and navigate to the last page.
The report footer with the report total appears at the end of the report.
- Make any necessary corrections.
- Save
[Clients - country totals]  Print the last page only.
- Close the report.
Simple Sum with Report Wizard
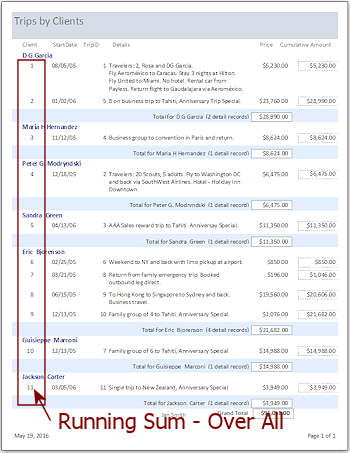
Next you will use the Report Wizard to create a report, Trips by Clients, which will show a total amount that each client has spent on trips. You will pull fields from two tables and a query. Of course what the Report Wizard produces will need some adjustments.
- On the Create ribbon tab, click the button Report Wizard.
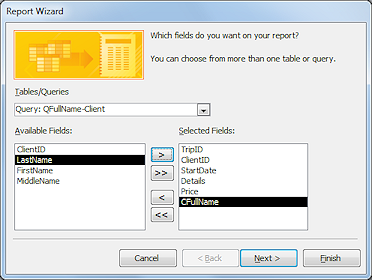 Select the following fields from the correct table or query:
- Trips table: TripID, ClientID, StartDate, Details, Price
- Query QFullName-Client: CFullName
- Click on Next >.
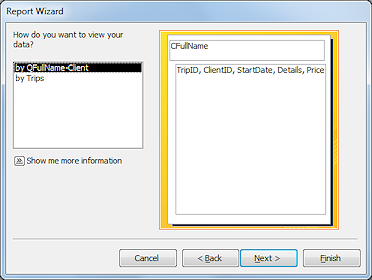 Select to view data byQFullName-Client.
The default grouping is by CFullName.- Click on Next >.
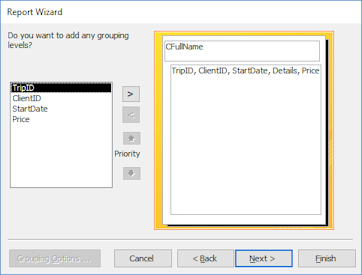 Do not select any other fields to group on.
The wizard next offers you the chance to pick another field to group on from the Trips table. Do not choose any of those.- Click on Next >.
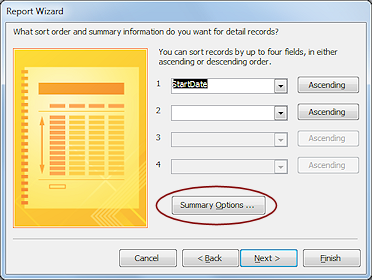 Step 3: Sort Ascending on StartDate.
-
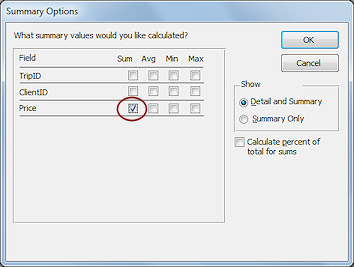 Click on the button Summary Options.
The Summary Options dialog opens. -
Check the box to Sum on Price and leave selected the default choice for what to show, Detail and Summary.
- Click on OK to close the dialog.
- Click on Next >.
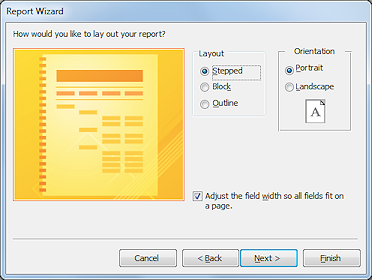 Choose the Stepped layout.
- Click on Next >.
-
 Access 2007: Choose format Access 2007 and click on Next>.
 -
Name the report Trips by Clients and click the Finish button.
The report opens in Print Preview. The default formatting and layout is a bit different depending on which version you are using. Access 2010, 2013, and 2016 produce very similar reports. But all versions need work! Some controls are too narrow to show the data in them. The Summary label is messy-looking. Some labels overlap. There is wasted white space.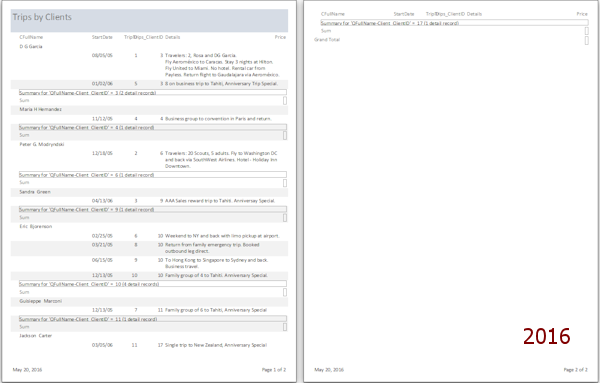
Edit Report
The Report Wizard gets the fields you chose onto the page. But, does it guess well about how wide each field really needs to be? It's a start, but you will nearly always want to make changes.
What needs fixing:
- Control width: Some controls need to be wider to show their content.
- Column labels: Some labels should be changed from the default field name.
- Alternating Back Color: If there are a lot of records, the alternating background colors can definitely help, but not for both records and groups at the same time. That is almost always confusing.
- Summary information: Too long and messy looking.
-
Sorting of group: The clients are not sorted alphabetically but are listed in the order that they appear in the Clients table, that is, by their ClientID. (Not all clients have trips entered in the Trips table).
The query from which you took the field CFullName sorts the full names alphabetically. The report is apparently ignoring that! This kind of problem will have to wait until the next lesson.
- Switch to Design View.
Be careful to not enlarge the width of the report beyond 8" while you make the changes below. -
Access 2007: Remove the table layout - Select the control CFullName and click on the Select Table button
 that appears at the top left of the control. In the ribbon tab Report Design Tools: Arrange, click on the button Remove. The controls are no longer bound to a table layout.
 -
Change the Width of the following controls:
CFullName control = 2"
StartDate = 1"


 Access 2010, 2013, 2016: The controls for the group and report total
look like a very small rectangle to start with.
Access 2010, 2013, 2016: The controls for the group and report total
look like a very small rectangle to start with.
Change the Width of the following controls:
Price = 1"
group total = 1"
report total = 1" - Delete Trips_ClientID control in the Detail section and its label in the Page Header section.
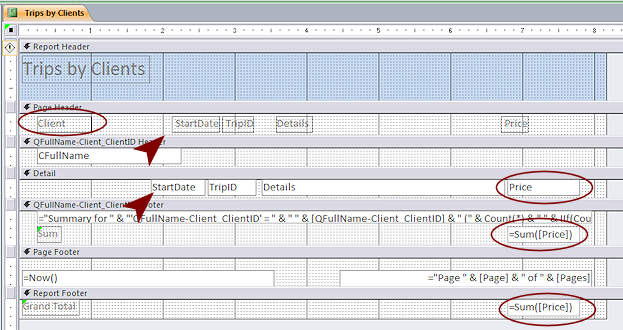
They are not adding anything and are not needed for sorting or grouping. - Change the label in the Page Header that reads CFullName to read Client.
- Move and resize as needed to keep the controls and labels from overlapping and yet wide enough to show the expected data. about the positions in the illustration. Use the illustration as a guide.
- Make sure that the total controls in the group footer and report footer line up with the Price control.
- If necessary, drag the right edge of the report back to the 8" line.
If controls are in the way, move them left until they clear the 8" line. - Save.
[Trips by Clients]
-
Switch to Print Preview.
The report includes a total for each grouping and for the whole report.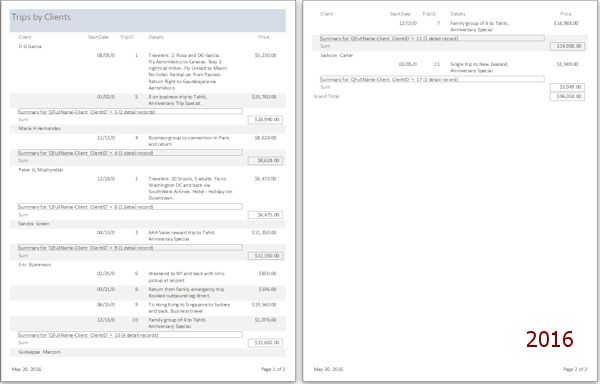
-
Inspect the preview carefully. Make sure all changes were made and that all values are showing in the records.
- Switch to Design View.
Now you can fix those backgrounds and the long Summary statement. -
Where necessary, change the Alternate Back Color for the group header and Detail section to No Color or to match the Background property.
- Change the Back Color and the Alternate Back Color for the group footer to Access Theme 2.
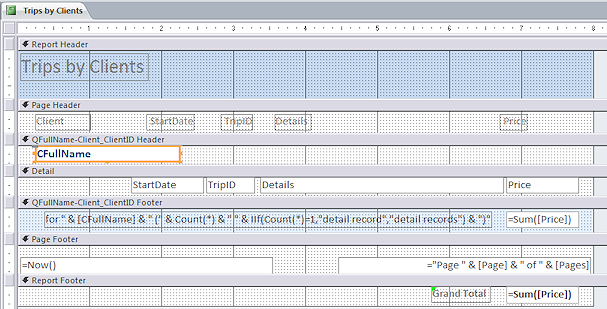
- Change the Name property of the Text12 control in the group footer, which has a long expression as its Control Source, to Summary.
- Set the Back Style property for the Summary control to Transparent.
- For the same Summary text box, change the Border Style to Transparent.
-
Edit the expression that is the Control Source for the Summary control to read:
="Total for " & [CFullName] & " (" & Count(*) & " " & IIf(Count(*)=1,"detail record","detail records") & ")" - With the button on the Home ribbon tab, align the Summary control Right.
This makes the results of the expression shift to the right end of the control. - Delete the Sum label in the group footer.
-
Resize the Summary control and position it beside the group total.
 Resize the group footer to the minimum height.
- Move the label Grand Total over next to the report total in the Report Footer.
- Format the Grand Total label and the report total as Bold.
- Format the control CFullName as 12 pt, Dark Blue, Bold.
- If necessary, move controls to the left and widen the Details control to make the report fit onto one page.
- Save.
[Trips by Clients] -
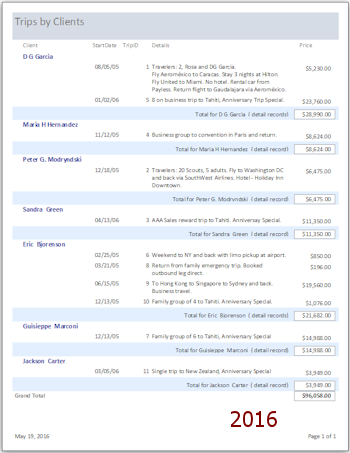
Switch to Print Preview.
Better. It's not perfect, but it will do for now.Your print preview may look a bit different from the illustration, depending on your version of Access and the exact sizes you chose for controls and sections.
Create a Running Sum
While it is not particularly interesting for this report, let's practice creating a running sum in the Detail section. This method can be used for situations where you want to total a calculated control (as we will do in the next lesson).
- Switch to Report Design View.
- In the Detail section, select the controls in the Detail section and drag them to the left to create some space at the right.
The left edge of the StartDate control should be about 0.5" from the left edge of the report. -
Drag the matching labels to the left also.
- In the Report Footer, drag the Grand Total label and the control to line up with the new position for the Price control in the Detail section.
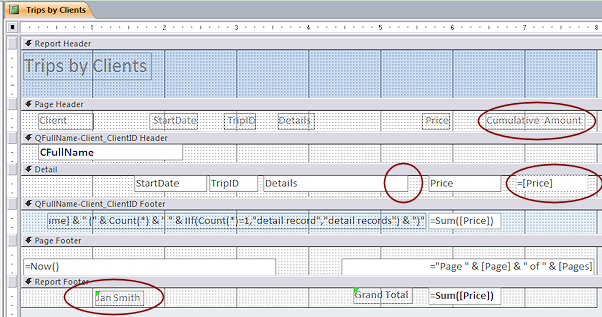
- Create a new unbound text box to the right of the Price control.
- Select the new control's label and use the key combo CTRL + X to delete the control's label.
- Click in the Page Header and paste.
The deleted label appears at the upper left of the section.
(You CAN drag a control with its label to a different section, but you CANNOT drag the label by itself to a new section.) -
Drag the pasted label to the right to be a column label above the new text box.
 Where it pastes: Objects
pasted in Design View appear at the upper left of the section that was
selected when you pasted. They can be hard to see if they overlap
other objects or are small, like thin lines.
Where it pastes: Objects
pasted in Design View appear at the upper left of the section that was
selected when you pasted. They can be hard to see if they overlap
other objects or are small, like thin lines.
- If necessary, align the new label vertically with the other
labels in the Page Header section.
Keep the section to the minimum size for the controls.
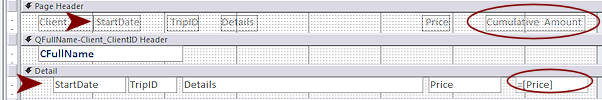
- Edit the label text to read Cumulative Amount
-
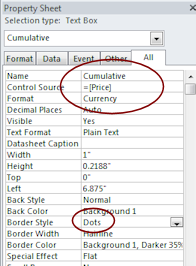 Select the control you just added and make the following changes:
- Change the Name property to Cumulative
- Set the control source to =[Price].
- Set Format to Currency.
- Set Border Style to Dots
- Set the Running Sum property to Over
Group.
-
Add a label to the center of the Page Footer containing your name.
(Hint: Type your name in the label and resize to Best Fit. Center the control around the 4" grid line.)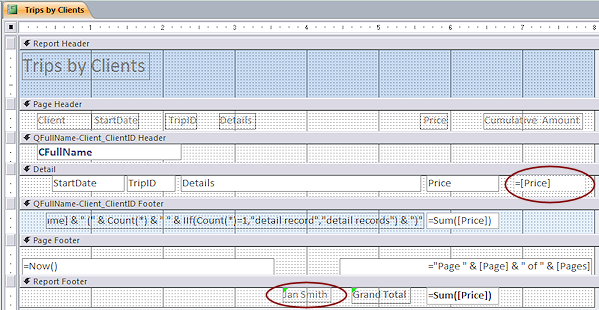
-
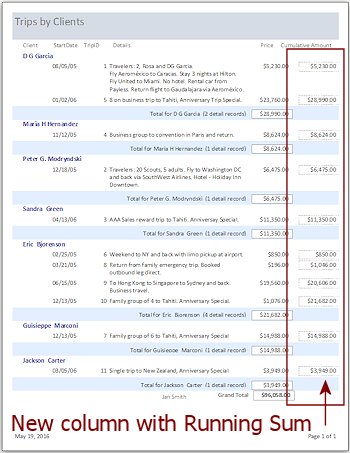 Switch to Print Preview.
The new column shows a total that increases with each new record in the group. The last record in a group will have the same total as the group's total, which was calculated separately.
In this report the column resets to zero for each new group. If the Running Sum property for the control is set to Over All, then the total will not reset but will keeping accumulating for the whole report.
- Save the report as Trips by Clients-Cumulative
Amount
Number Each Record with Running Sum
The Running Sum property can also be used to number each record, either within a group or over the whole report.
Next you will number each trip at the left over the whole report. Why? For practice, of course!
- Switch to Report Design View.
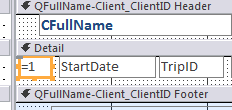 Add a new unbound text box control to the Detail view, at the
left of the StartDate control.
Add a new unbound text box control to the Detail view, at the
left of the StartDate control.
- Delete the label for the new control.
- Align the new control with the top of the other Detail
controls.
- In the Property Sheet for the new control, change the following:
- Control Source to =1
- Format - type a period
- Running Sum to Over All
- Access 2010, 2013, 2016: Border Style = Transparent
-
 Save the report as Trips by Clients-Numbered
- Print. (1 page)
|
|
| © 1997-2017 Jan Smith All Rights Reserved |
Site Map What's New |
Privacy Policy Terms of Service Copyright Acknowledgements |
~~ 1 Cor. 10:31 ...whatever you do, do it all for the glory of God. ~~
Last updated: March 22, 2017