
Jan's Working with Databases
Forms & Reports: Reports: Groups
Once you have the records that you want in your report, you can decide if you want to sort or group them.
What is a group?
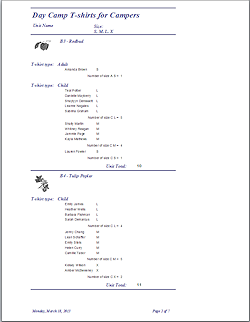
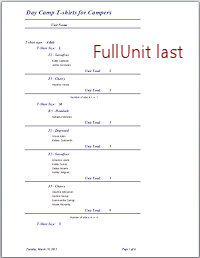
Campers, grouped by camp unit, then T-shirt type, and then size
(from Day Camp database)
A group is a set of sorted records that match a value or interval, like having the same postal code or having a purchase date in the same month or starting with the same letter. You can sort each grouping level differently.
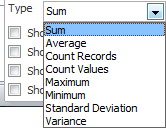
Each group can show a Group Header section, a Group Footer section, both, or neither. In a group header or footer you can put a label for the group or calculate totals with an aggregate function, like Count Records, Count Values, Sum, Avg, Max, or Min. This feature is what makes grouping more powerful than just sorting.
You can group on any field from the source of the report except a Memo/Long Text or Attachment type. You can also use an expression, but not a calculated control.
For example, you could group campers by their unit or grade or age or postal code or by the first letter of their last name. You could group products by price or category or manufacturer or number sold for the month.
How to Create a Group
-
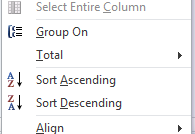 Context Menu: Right click a control and choose Group On.
You can also use this menu to sort with this control or to add a total based on it.
Only one sort can be created with the context menu. A second choice replaces the first one.It is a good idea to open the Group, Sort, and Total pane to see how your choices are fitting together.
-
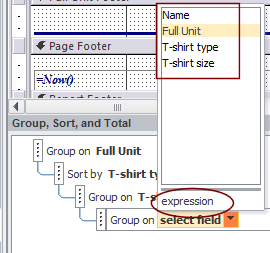
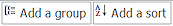 Group, Sort, and Total Pane: Click the Add a group or Add a sort button.
A list of available fields pops up. At the bottom of the list is 'expression', which opens the Expression Builder dialog.Once you have created a group you can edit its properties in the pane.
![]() Using a Calculated Control:
Using a Calculated Control:
You won't see any of your calculated controls from the report
in the 'Group on' list, only fields from the report's source. You
can copy an expression from a calculated control, open Expression Builder, and paste to use the expression for grouping.
Or, you can change the Control Source for the report to a query that includes the calculation as a column. Then it will show as a choice in the dialog.
Using the Group, Sort, and Total Pane
 Grouping, sorting, and totals are best controlled from a pane that is available only for reports. This is quite different from previous versions of Access. It puts all of the choices in one spot!
The pane gives you total control, unlike using the context menu commands.
Show pane: Group & Sort button ![]() on the Report Design Tools: Design ribbon tab.
on the Report Design Tools: Design ribbon tab.
Hide pane: Click the Group & Sort button again or click the X button at the top right of the pane.
How many groups? You can choose up to 10 fields or expressions to sort or group on.
 Order of sorting/grouping? The sorting/grouping is done in the order
of the diagram in the pane, starting with the top. The Design View also shows group headers in this order, but a group does not HAVE to have a group header or footer. The pane tells ALL, if you look.
Order of sorting/grouping? The sorting/grouping is done in the order
of the diagram in the pane, starting with the top. The Design View also shows group headers in this order, but a group does not HAVE to have a group header or footer. The pane tells ALL, if you look.
Change the order with the blue arrows at the right end of the item. You cannot drag an item to change its place in the order.
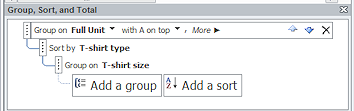
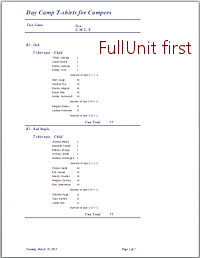
The order of the groups is VERY IMPORTANT! In the first illustration, records are grouped first by Full Unit name, then by T-shirt type (Adult or Child) and then by T-shirt size (S, M, L, X). In the second illustration, the order was changed to put FullUnit last. The resulting pages are VERY different.
When you change the grouping order, you usually have to adjust the positions of some controls. You might need to remove some Totals and create others. Inspect the Print Preview carefully!
Group Properties
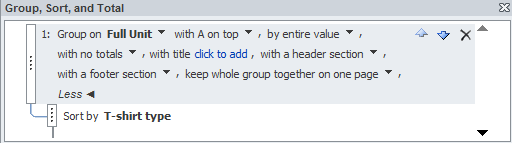 Click on an entry in the Group, Sort, and Total diagram to show its current properties.
Click on More ![]() to open a longer list of features. Only one group properties list can be open at a time. To collapse the entry again click on Less or on a different entry in the diagram.
to open a longer list of features. Only one group properties list can be open at a time. To collapse the entry again click on Less or on a different entry in the diagram.
A down arrow ![]() beside a property for a group opens a list of choices for the property. There are different choices for different data types.
beside a property for a group opens a list of choices for the property. There are different choices for different data types.
Values for Properties
- Sorting:
Text: A on top (default) or Z on top
Date/Time: oldest to newest or newest to oldest
Number: smallest to largest or largest to smallest - By what value:
Text: entire value (default) or on first character or first two characters (for text fields) or a custom number of characters
Date/Time: day, week, month, quarter, year, or a custom number of minutes, hours, or days.
Number: by 5s, 10s, 100s, 1000s or with a custom interval. -
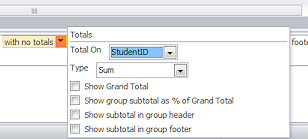 Totals:
No total (default) or pick a field to 'total' and pick a function, like Sum or Count Records or Maximum.
Show a Grand Total, which is in the Report Footer by default. Show the group total as a percentage of the Grand Total. Put the subtotal for the group in the header or in the footer or both. Vanishing Choices: Oddly, the choices you make in the drop list for Totals may not show in the drop list if you return to the pane later. What you are totaling, like 'with AmountPaid totaled', shows in the pane but not which function you picked, like Sum or Count Records, or Maximum. The check boxes are all unchecked when you come back.
- Title:
'Click to add' opens a Zoom window for you to type a text title for the group.
- Group Header or Footer:
- With or without a header
- With or without a footer
 Keep Together:
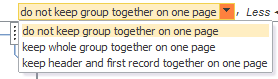
- Do not keep group together on one page (Default value)
Normal flow from page to page. This can result in a group header being on the bottom of a page by itself and the first record landing on the next page.
- Keep whole group together on one page:
Forces a new page if the group won't fit on the current page. Group will then flow onto more pages if necessary, but the next group will start on a new page. - Keep header and first record together on one page:
Keeps the group header from getting stranded at the bottom of a page by itself.
- Do not keep group together on one page (Default value)
Example: Single Group
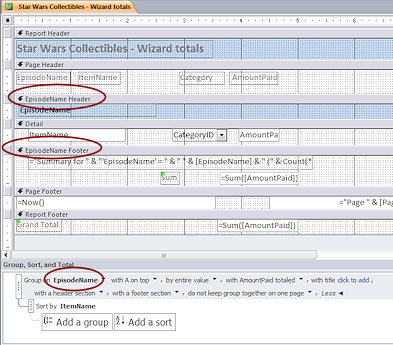
In the Star Wars Collectibles database,, a report based on a query groups the items in the collection on the EpisodeName field. This report is an edited version that was originally created with the Report Wizard, choosing to show group totals and a Grand Total.
 In
the Group, Sort, and Total pane, there is a single grouping on EpisodeName, which is sorted in alphabetical order and then an additional Sort by ItemName.
In
the Group, Sort, and Total pane, there is a single grouping on EpisodeName, which is sorted in alphabetical order and then an additional Sort by ItemName.
Other features: Totaled on AmountPaid. Header and Footer both shown. Grand Total in the Report Footer.
In Report Design View, the group header includes a control for a title for the
group. The group footer
includes a group total and a control that automatically counts the records in the group.
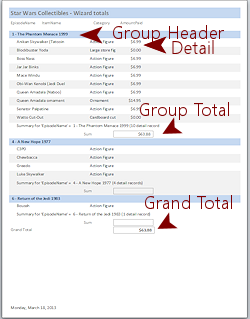
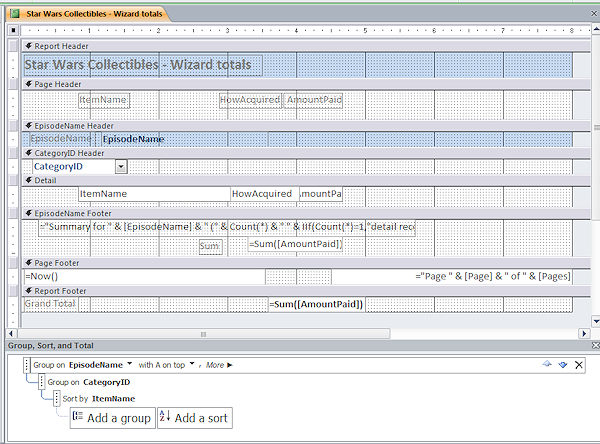
Example: Two Groups
 In
the Star Wars Collectibles database, a report groups the records
by EpisodeName and then by CategoryID. Within a category, items are also sorted on ItemName. The order in
the Group, Sort, and Totals pane is VERY important.
In
the Star Wars Collectibles database, a report groups the records
by EpisodeName and then by CategoryID. Within a category, items are also sorted on ItemName. The order in
the Group, Sort, and Totals pane is VERY important.
In Design View you can see section bars for the headers and footers that will show. But, there is no bar for the CategoryID Footer, which is hidden.
In the Group, Sort, and Total pane you can see what is used to Group or Sort easily. If a group is also sorted, the sort rule shows to the right on the Group line.
To see what Totals are used you must select an item in the diagram and click the More button.
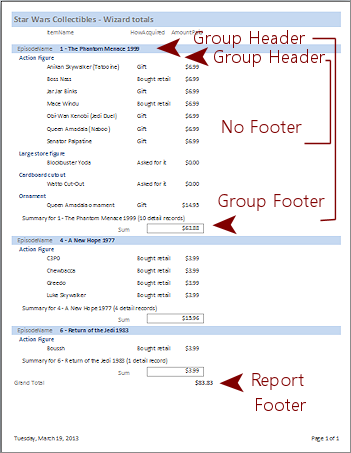 In Print Preview, this report shows group header and footer for EpisodeName (blue background). The group footer has a Total which is the sum of the AmountPaid.
But the CategoryID group shows only a group header, no footer.
It is common to indent the group headers slightly and use different formatting. This helps you to spot the change in the report groupings.
The Grand Total of AmountPaid is in the Report Footer, which is at the end of this one-page report.
| |
Step-by-Step: Groups |
|
| What you will learn: | to create group |
Start with: ![]() , resource files, worldtravel-Lastname-Firstname.accdb from folder databases project4 as updated in the previous lesson
, resource files, worldtravel-Lastname-Firstname.accdb from folder databases project4 as updated in the previous lesson
World Travel Inc. wants your Clients Report to show how many clients are in each country. You need to add some groupings and totals to your report. There are only a few clients in the table so far. The more complex the grouping and sorting is, the more records it takes to see if you are getting the arrangement that you wanted.
Group by Country
Currently the Clients Report is not sorting the records at all. The report shows the records in the order in which they were entered in the underlying table. That could be exactly what you want for some reports. For this one, however, you want to see how many clients are from each country. You could sort them on Country and then count by hand. A better way is to group the records so that you can make Access count for you.
 If necessary, open the Clients Report from the previous lesson in Report Design View.
-
 Save the report as Clients - by country.
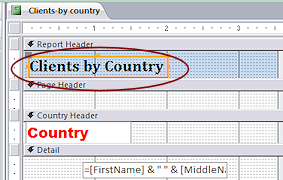
 Right click on the control Country.
- From the context menu, select Group On.
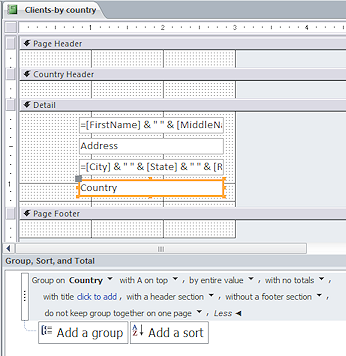
Access adds a Country Header to the Design View.
If the pane Group, Sort, and Total was not open, it does NOT open automatically. -
If necessary, click the Group and Sort button
 on the Report Design Tools: Design ribbon tab to open the pane Group, Sort, and Total at the bottom of the window.
The default choices are OK for most of the properties, but not all. -
Click the More button
 in the item Group on Country to expand the display.
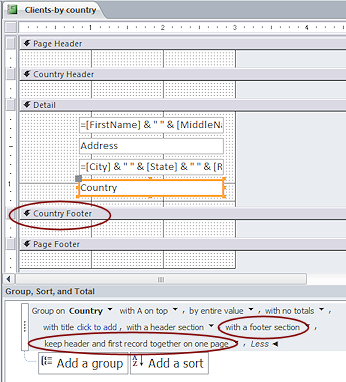
Change the properties to the following:
- with footer section
-
keep header and first record together on one page
The Design View changes to include the new group footer section. No controls are added automatically to the new sections.
Nothing in the Design View tells you whether the group will be kept together or just header and first record or not, except what is in the Group on Country information in the bottom pane.
-
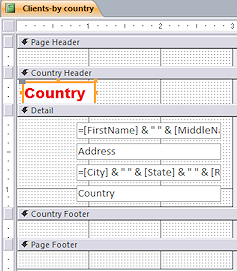 Drag the field Country from the Field List and drop it in the Country
Header.
Drag the field Country from the Field List and drop it in the Country
Header.
-
Delete the label for the new control.
- Format the Country control as Arial Black, Red, 14.
- Resize the Country control as Best Fit.
The Country Header section may enlarge, depending on exactly where you dropped the control.
-
If necessary, move the control to the top left of the section.
- If necessary, drag the bottom edge of the Country Header section up to leave no extra space below the control.
-
Save the report.
[Clients - by country]
Add and Format Divider Lines
Headers and footers often benefit from using different background color, fonts, font color, and font size than the Detail section. Divider lines can be helpful, too. You just have to be sure that your divider lines are lined up neatly with each other.
![]() Resizing
lines: Use the Property Sheet to set a line's width or height.
It is difficult to drag a line to resize it without making it slant. Slanted lines often look jagged when printed.
Resizing
lines: Use the Property Sheet to set a line's width or height.
It is difficult to drag a line to resize it without making it slant. Slanted lines often look jagged when printed.
Click the Line tool
 on the ribbon tab Report Design Tools: Design.
-
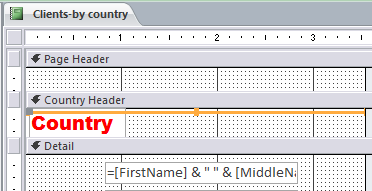
Click in the Country Header section, just above the Country text box.
A 1 inch line appears, starting where you clicked. -
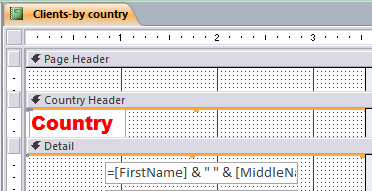
Use the Property Sheet for the line to change the following properties:
Width = 3.5"
The report width enlarges automatically to hold the longer line.
Top = 0"
This puts the line at the top of the section.
Leave the Border Width as Hairline. -
 With the line still selected, copy the line. (CTRL + C)
-
Click the Detail section bar, not inside the section.
-
Paste. (CTRL + V)
A new line appears at the very top of the Detail section.
-
With the second line still selected, hold the SHIFT key down and drag across the line in the Country Header to select it.
Now both are selected. Selecting hard-to-see
controls, like lines:
Selecting hard-to-see
controls, like lines:
Be sure that Access is set to select with partial enclosure.
(Options > Forms and Reports)
Drag across a part of the area where you think the control is. Look for handles to appear. If you wind up selecting too many controls, hold SHIFT down and click on the ones you don't want to deselect them.It can be hard to see that there is a line there when it is right next to the section bar as in the illustration. Once you select it, there are orange borders and handles. Even then it is not as obvious as with a rectangle control.
- Right click somewhere on the selection.
A context menu appears. - Select Align and then Left.
The two lines line up at their left ends, if they were not exactly lined up.
- If the lines are not all the way to the left edge of the design window,
while they are still selected, press the left arrow key to move them left until they are at the edge.
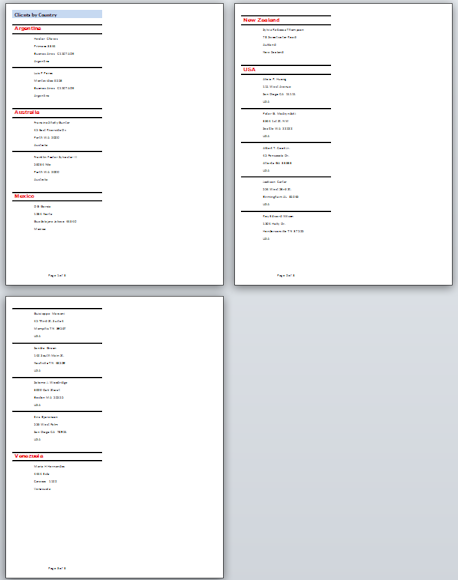
 Switch to Print Preview.
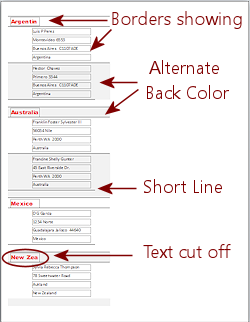
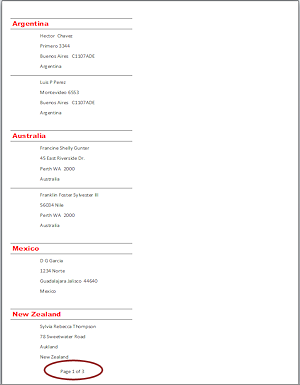
The clients for each country are clearly separated by the group header - the Country name.
(Your report may flow differently on the pages, depending on exactly how tall your sections are.)
Problems to Fix:


 Access 2010, 2013, 2016: Borders around the text boxes, which makes the data harder to read.
- Access 2010, 2013, 2016: Alternate Back Color for records and groups makes this report harder to read.
- There is a dividing line below the record, which is not the same width as one at the top. These lines create an odd double line in some places.
- Long country names are cut off.
Fix Layout Problems
Next you will fix the problems listed above.
- Switch to Report Design View.
- Resize the Country control
to at least 1.5" wide.
(Remember - if your control is not at the left edge of the report, 1.5" on the ruler is not where the right edge of the control will line up!) - Remove the shorter line at the bottom of the Detail record.
- Drag the bottom edge of the Detail section up as far as possible.
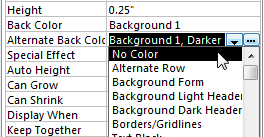 In the Property Sheet, set the Alternate Back Color for the Country group header, the Country group footer, and the Detail section to No Color, which is in the down arrow drop list (not the ellipsis button color palette) or to Background 1, if No Color is not available.
-
Access 2010, 2013, 2016:
Select the text box controls but NOT the lines.
Set the Border Style to Transparent. 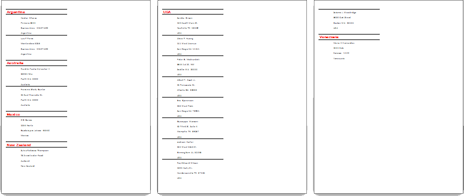 Switch back to Print Preview and inspect again.
Make any corrections needed. Your report might flow the records differently, depending on exactly what size your sections are.
-
When the
report is in good order, save the report.
[Clients - by country]The report uses 3 pages.
Sorting Within Groups
The clients should be sorted alphabetically within each Country group. The control FullName on the report holds the client's name. It is not in the Field List since it is a calculated field. In its right click menu the command Group On is disabled. (Since FullName starts with the first name instead of the last name, it is not suitable for sorting anyway!)
So how can you sort the names? Use the original fields from the report's source.
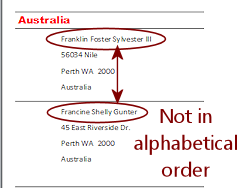
 In Report view, scroll to inspect the report's alphabetizing.
The country names are in alphabetical order but the clients within a country group are not. They are still listed in the order they were entered into the database. Not good!
-
Switch back to Report Design View.
-
 In
the pane Group, Sort, and Total , click the button Add a sort.
In
the pane Group, Sort, and Total , click the button Add a sort.
A list of fields from the report's source appears. - In the field list, select LastName.
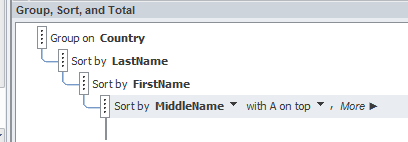
- Repeat,to add a sort for FirstName and then a sort for MiddleName.
 Switch to Print Preview and inspect the alphabetizing.
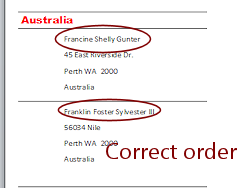
Now the clients are sorted alphabetically within each country.
(It is easier to check this sort of change in Report View, where you can scroll!)
-
Save the report.
[Clients - by country]
Page Numbers
No view in Access tells you how many pages there are directly. You can, of course, navigate in Print Preview to the last page. The Navigation Bar in that view shows the page number. BUT, it can take Access a long time to format all of the pages before it can show you the last one.
So, if your report is longer than one page, you would be wise to include page numbers and the total number of pages in the page header or footer. That way you can see the total number of pages on the very first page. Access makes this very easy!
-
Switch to Report Design View.
-
 From
the ribbon tab Report Design Tools: Design, click on
From
the ribbon tab Report Design Tools: Design, click on  , the Page Numbers button.
The Page Numbers dialog appears.
-
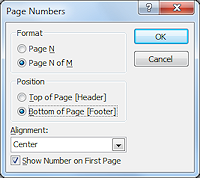
Select 'Page N of M'
-
Select 'Bottom of Page [Footer]'.
-
Select 'Center'.
-
Check the box for 'Show Number on First Page'.
Click on OK.
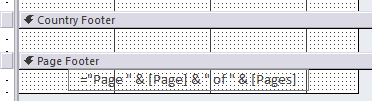
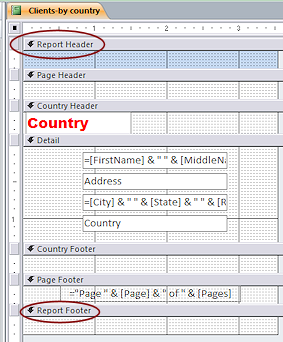
Report Design View now shows a calculated control in the Page Footer section that uses literal text and two special fields, Page and Pages. The expression is:
="Page " & [Page] & " of " & [Pages]-
 Switch to Print Preview and inspect the two
pages of the report.
Switch to Print Preview and inspect the two
pages of the report.
The first page shows "Page 1 of 3" at the bottom of the page. Problem:
Page numbers are not centered on the paper
Problem:
Page numbers are not centered on the paper
This control is not centered on the paper even though you choose Center alignment in the Page Numbers dialog.
Why: The width for the report is 3.5" but the paper is 8.5" wide. The control IS centered but only within the width defined in Report Design View. Not a problem after all.
-
Save the report.
[Clients -by country]
Report Header
Looking at all pages of this small report, do you notice that something is missing?? There is no title. You may remember for a few days what this report was all about. But what about after a few months? A title that clearly identifies what this report is about is always a good idea!
![]() Unexpected white
space
Unexpected white
space
Adding new sections to a report can
change the way the groups and records fall on the pages. How are your groups set to handle page breaks? If you chose to 'keep whole group together on one page', you
may wind up with a lot more white space than you expected!
Even choosing 'keep header with first record' can result in
a noticeable blank spot if the group header or Detail section are fairly
tall.
- Switch to Report Design View.
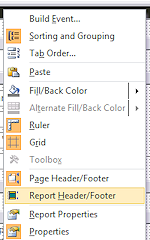 Right click on a section bar and choose Report Header/Footer.
Two new sections appear, at the top and bottom of the Design View window.
 Access 2007: Does not have the blue background for the Report Header.
- Use the Label tool

 from the Report Design Tools: Design ribbon tab
to create a new control at the left of the Report Header section.
from the Report Design Tools: Design ribbon tab
to create a new control at the left of the Report Header section.
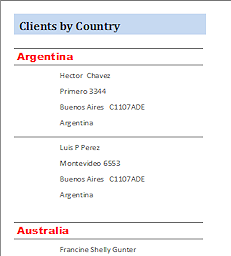
- Type Clients by Country as the
text for the label.
- Click out to get out of Edit mode.
- Click on the new control to select it again.
- Format the control with Cambria, font size 14, Bold, black.
 Double click the edge of the control to resize it to fit
the text.
Double click the edge of the control to resize it to fit
the text. - Switch to Print Preview.
 What changed: The report title shows only on the first page. Adding
this section may have changed the way the report falls on pages. Your report may look different from the illustration, depending on the exact heights of your various sections.Problem: New Zealand is on the first page unlike the illustration
What changed: The report title shows only on the first page. Adding
this section may have changed the way the report falls on pages. Your report may look different from the illustration, depending on the exact heights of your various sections.Problem: New Zealand is on the first page unlike the illustration
This might happen if your section heights are slightly shorter than what I used to create the illustration.The Country group is set to keep the group header with the first detail. After adding the report title, if there is not enough space on the first page for both the next Country group header and the first record, both move over to the second page. That's exactly what the property is designed to do. The exact height of each section plus the page margins determines how much can fit on a page.
- Save the report.
[Clients -by country]
Two Groups
Now that your report is looking better, let's get a bit deeper into the groupings. What will change if you have more than one group? Usually you will want to show a header for the new group and include a label in the Group Header.
You will add a group for the PostalCode field. Usually you should have your groups first and then the fields that are just sorted.
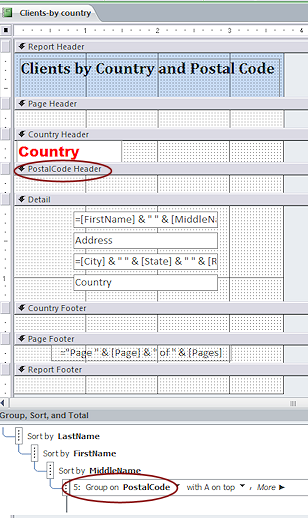 Switch to Report Design View.
- In the Group, Sort, and Total pane, scroll to see the Add a group button.
- Click Add a group and from the field list select PostalCode.
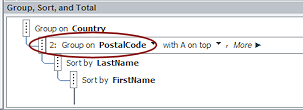
In the pane, the new group is added to the bottom of the list. - Click the blue up arrow at the right end of the PostalCode item to move it up one level.
-
Repeat twice more to move it to the second level in the diagram.
(You will need to scroll up to see the Group on Country item.)
 There is no change in the Design View. You did not change the order between the two groups, just between a Group and the three Sort items.
The order of the items in the Group, Sort, and Total diagram is very important to what you will see in the report.
-
Change the following setting for the group PostalCode:
keep whole group together on one page
 From the Field List, drag the PostalCode field and drop it in the new group header section.
- Delete the control's label.
- Format the control as 12 points, Bold, and Green.
- Resize the control to Best Fit.
- Position the new control a bit indented from the Country control with no space below the control itself.
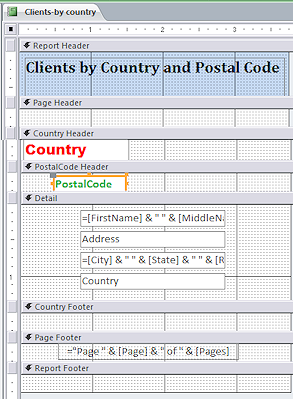
- Edit the Report title to read Clients by
Country and Postal Code.
The control will automatically resize to fit.
-
 Switch to Report View
 - Scroll the whole report.
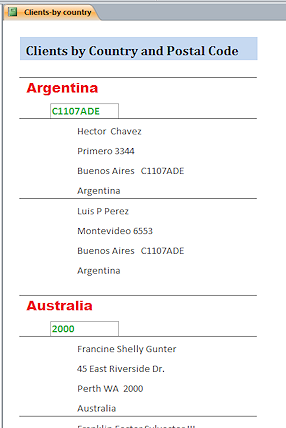
What changes do you see?- Items within a Country group are grouped on PostalCode values.
- Clients within a postal code are alphabetized, Last name, First name, Middle Name.
- Alternate Back Color is used on PostalCode groups within a country .
(Look at at the USA records.) - Access 2010, 2013, 2016: The postal code group header has border.
- Switch to Report Design View.
- Select the PostalCode group header and change the Alternate Back Color property to No Color or Background 1 if No Color is not available.
-
Access 2010, 2013, 2016: Select the PostalCode control in the PostalCode group header and change its Border Style to Transparent.
- Switch to Print Preview.
- Navigate to each page.
The report is longer now because of the new group header section. On the first page it is hard to tell if the new grouping level is working correctly. The first two countries have two records each, but they have the same postal code.
-
 Navigate to page 2.
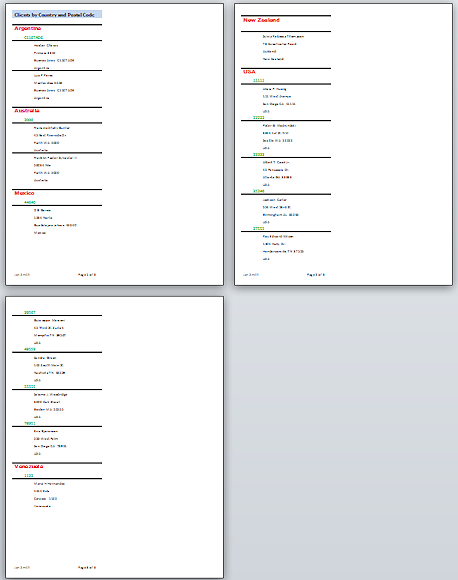
Interestingly, New Zealand does not use postal codes.There is a separate grouping for each of the postal codes for the USA addresses so the new grouping is working.
- Switch to Report Design view.
- Resize the control in the Page Footer to Width = 1".
- Move the control to the far right of the report, which is still on 3.5" wide.
- Add a text label to the far left of the Page Footer with your name.
- If necessary, resize sections to get the report to print on just 3 pages.
-
 Print all 3 pages.
- Save the report as
Clients-by country and postal code
|
|
| © 1997-2017 Jan Smith All Rights Reserved |
Site Map What's New |
Privacy Policy Terms of Service Copyright Acknowledgements |
~~ 1 Cor. 10:31 ...whatever you do, do it all for the glory of God. ~~
Last updated: March 22, 2017