
Jan's Working with Databases
Tables & Queries: Queries: Crosstab Query
![]() A crosstab
query displays a table of "total" values, grouped on at least two fields, one
used as row headings and one as column headings. The "total" is a sum,
count, average, or some other calculation.
A crosstab
query displays a table of "total" values, grouped on at least two fields, one
used as row headings and one as column headings. The "total" is a sum,
count, average, or some other calculation.
Example: Averages
A crosstab query can create a datasheet of score averages, like the one
below from the Language Arts Classes ![]() database. Student names and ID numbers are listed
down the left (2 sets of row headings) and the subject/type categories are across the top
(column headings), like Reading Daily, Reading Quiz, Reading Test, etc. The value in the cell is the average of the scores that the student (row) made on
assignments in that subject/type (column).
database. Student names and ID numbers are listed
down the left (2 sets of row headings) and the subject/type categories are across the top
(column headings), like Reading Daily, Reading Quiz, Reading Test, etc. The value in the cell is the average of the scores that the student (row) made on
assignments in that subject/type (column).
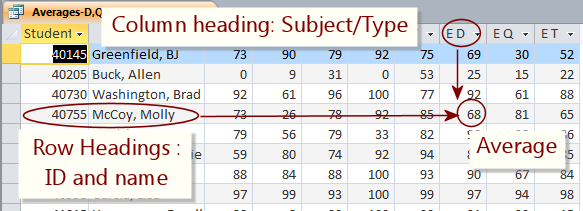
Molly McCoy's average for English Daily work is 68.
A similar crosstab query might calculate the term grade for a subject.
Example: Crosstab Query - Count with row totals
This example comes from the Day Camp ![]() database in your resource files.
database in your resource files.
T-shirt Problem: On the first day
of a summer day camp how many T-shirts of what sizes do you need?
Each unit has a different number of campers and staff.
In this example, (from a database created for a real day camp) there are 12 units including 'All' for staff not assigned to a unit, 4 sizes for Adult-sized T-shirts, and 4 sizes for Child-sized T-shirts. This could be messy! A crosstab datasheet is a very useful way to display this information.
Rows: The combinations of unit and T-shirt type (Adult or Child sizing) are listed down the left (row headings). Each unit needs at least 2 rows, one for the Adult sizes and one for Child sizes. A third row appears if there is a record that does not list a T-shirt size. That could be from a data entry error or else a registration form that did not indicate a T-shirt size.
Columns: The sizes are across the top (column headings). The column <> is for records that do not have a value for the T-shirt size. This crosstab query also includes a Total for each row, Total Of ID. Very useful when counting out the stacks.
The sizes across the top and the units down the side are in alphabetical order by default. To sort columns in order by increasing or decreasing size (X, L, M, S), we would need another table that ordered these sizes and had a relationship to the T-shirts table.
Cells: The value in a cell is the Count of T-shirts needed of that size (column) for that T-shirt type (row) and camp unit (row).
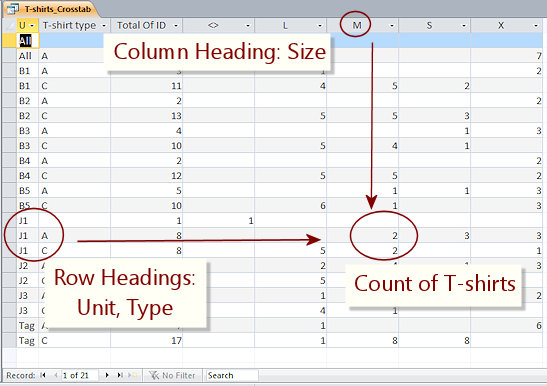
Examine the 3 rows for the unit J1. This unit needs both Adult size T-shirts and Child sizes. One record in J1 does not have a T-shirt size entered (Column <>).
| A total of 8 adult (A) T-shirts (Total Of ID): 2 medium (M) 3 small (S) 3 extra large (X) |
A total of 8 child (C) T-shirts (Total Of ID): 5 large (L) 2 medium (M) 1 extra large (X). |
Crosstab Query Wizard
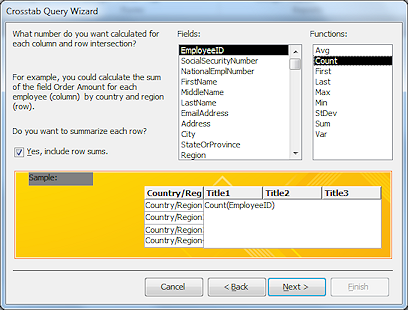
Access tries to make creating a crosstab query easy. The Crosstab Query Wizard walks you through the choices that you must make. You must pick one or more fields for row headings and one field for column headings. You must pick a field to use for the value in the cell, which is a calculation like a SUM or COUNT.
Let's look at the steps to create the T-shirts_Crosstab query shown above.
 You
start the Crosstab Query Wizard from the Query Wizard button
You
start the Crosstab Query Wizard from the Query Wizard button ![]() :
:
Create ribbon tab > Query Wizard > Crosstab Query Wizard
Step 1 > Step 2 > Step 3 > Step 4 > Step 5
Design View of the query:
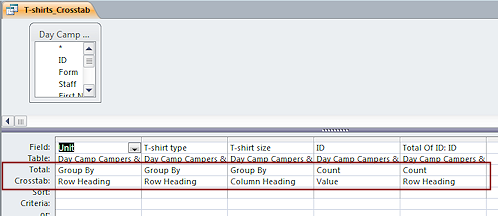 The
design view of the query shows that it is a Totals query, with a
new row in the grid, Crosstab. The choices for the Crosstab row are Row Heading,
Column Heading, Value, and (not shown).
The
design view of the query shows that it is a Totals query, with a
new row in the grid, Crosstab. The choices for the Crosstab row are Row Heading,
Column Heading, Value, and (not shown).
| |
Step-by-Step: Crosstab Query |
|
| What you will learn: | to use the Crosstab Query Wizard |
Start with: ![]() , Projects database from previous lesson open.
, Projects database from previous lesson open.
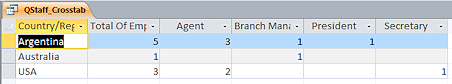
The tables in the Projects database are clearly not complete. You will, however, construct a crosstab query that will help when there are many more records in the tables. Your crosstab query will count the number of people with a particular Title for each Country/Region. This shows you how many agents, how many branch managers, etc. are in the country or region.
-
On the Create ribbon tab, click on the Query Wizard button
 .
.
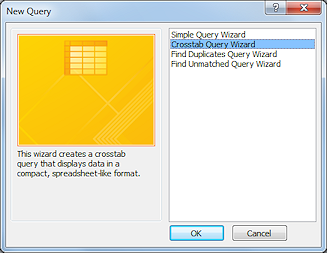
The New Query dialog opens.
-
Select Crosstab Query Wizard and click on OK.
The wizard opens.
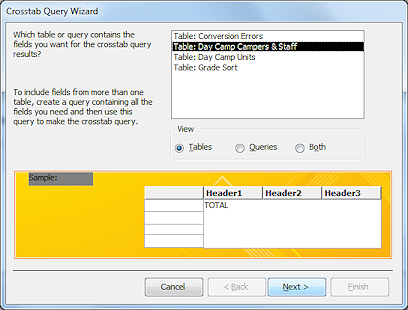
-
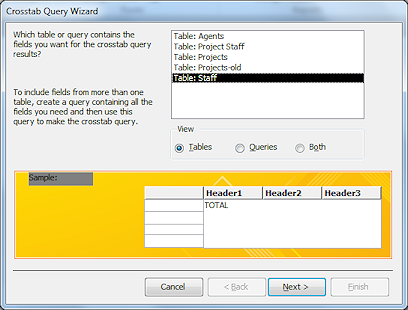 Step
1 - Source:
Step
1 - Source:
Select the table Staff and click
Next >.
-
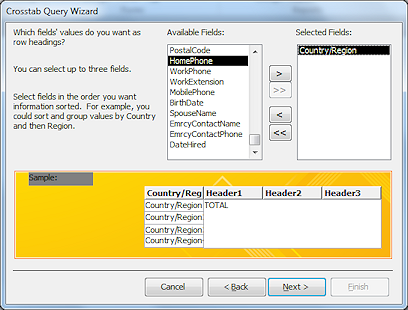 Step
2 - Row heading(s):
Step
2 - Row heading(s):
Select Country/Region and click the > button to move the field to the Selected Fields list.
Click Next>.
-
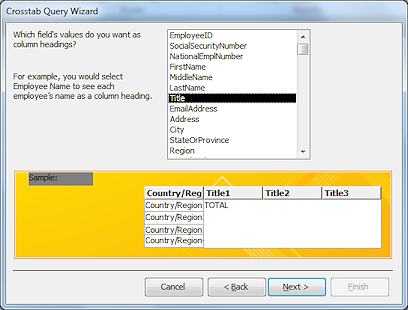 Step
3 - Column heading:
Step
3 - Column heading:
Select Title.
Click Next>.
-
 Step
4 - Value:
Step
4 - Value:
Select Count.
Click Next>.
-
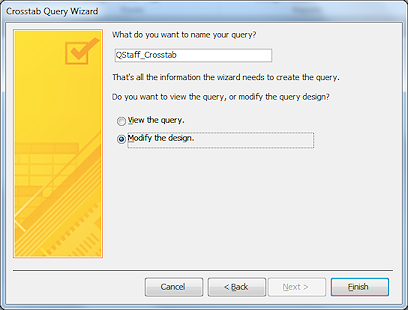 Step
5 - name:
Step
5 - name:
Type QStaff_Crosstab.
Click on Modify the design.
Click Finish.
The query is automatically saved.
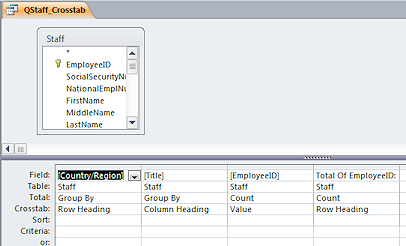
 The
wizard closes and the query opens in Query Design view.
The
wizard closes and the query opens in Query Design view.Notice that there is a column for EmployeeID and one for the Total Of EmployeeID:[EmployeeID]
 Run the query.
 The column Total of EmployeeID is a sum for the row, the number of
employees in each country. The other columns count the number of
employees with that job title in that country.
The column Total of EmployeeID is a sum for the row, the number of
employees in each country. The other columns count the number of
employees with that job title in that country.
 Exchanging the row and column choices in the wizard would give you the
number of employees for each job title.
Exchanging the row and column choices in the wizard would give you the
number of employees for each job title.
-
 Close the query and save the changes.
|
|
| © 1997-2017 Jan Smith All Rights Reserved |
Site Map What's New |
Privacy Policy Terms of Service Copyright Acknowledgements |
~~ 1 Cor. 10:31 ...whatever you do, do it all for the glory of God. ~~
Last updated: March 27, 2017