Tables & Queries:
Calculated
Values - Totals

Did you want: Working with Databases: Access 2007, 2010, 2013, 2016
Tables & Queries: |
Did you want: Working with Databases: Access 2007, 2010, 2013, 2016 | |||||
|
| ||||||
|
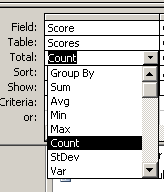
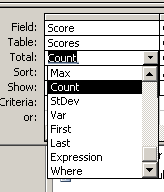
The Totals button
|
Project 3: Tables & Queries
| |||||||||||
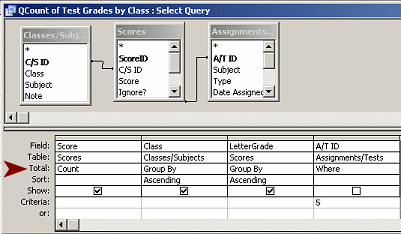
Rules for Creating an Aggregate Query:
| ||||||||||||
|
|
Step-by-Step: Calculated Values - Totals |
|
|
What you will learn: |
to use the Total row to count records to open a second database while the first remains open to use the Total row to sum and to average to group a total's results on a calculated field |
Start with:
![]() , Projects
database open, mytrips.mdb available (created in Project 2: Access Basics)
, Projects
database open, mytrips.mdb available (created in Project 2: Access Basics)
You will create a query to answer the question "How many staff members are assigned to each project?" You will need a Total query that uses the Count function to count employees. You can then group the results on ProjectName or ProjectID.
 If necessary, switch to the Database Window
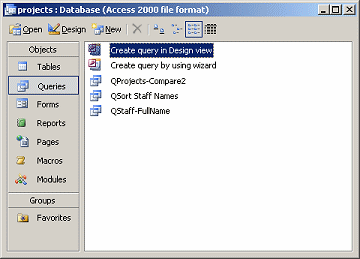
and view the Queries list.
If necessary, switch to the Database Window
and view the Queries list.
Click the New button
![]() at the top of the Database Window.
at the top of the Database Window.
The New Query dialog appears.
Select Design View and click OK.
The Query Design View appears with the Show Table dialog open.
 Select
the tables Projects and
ProjectStaff and click Add.
Select
the tables Projects and
ProjectStaff and click Add.
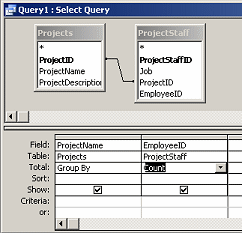
The two tables are added to the upper section of the Query Design View
with a join line based on the relationship that you defined between them
earlier.
Close the Show Table dialog.
From the table Projects
drag the field ProjectName and drop
it on the grid at the bottom.
From the table ProjectStaff
drag the field EmployeeID and drop it
on the grid.
Click the Totals button
![]() in the toolbar to show the Totals row.
in the toolbar to show the Totals row.
In the column for ProjectName
select Group By.
In the columns for EmployeeID select
Count.
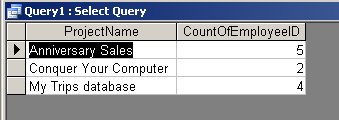
![]() Run
the query.
Run
the query.
Drag the right edge of each column until
the column is wide enough to read everything.
The datasheet shows how many employees are assigned to each project in
the database.
![]() Save the query as QCount Project Staff.
Save the query as QCount Project Staff.
Close the query.
The Projects database does not yet have any number fields that are suitable for adding up or averaging. The MyTrips database that you created in Project 2 does. Recall that to open a second database without closing the first one requires you to first open a new instance of Access. Various methods were discussed in Project 2, Access Basics: Open Access.'
 Do
not close the Projects database.
Do
not close the Projects database.
Open a new Access window.
One way:
|or ||A new Access window appears. The task pane should be open at
the right with recently used files showing in the Open list.
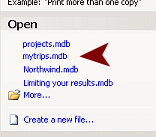
![]() Problem: List has more
than one mytrips.mdb
Problem: List has more
than one mytrips.mdb
Cause: You have copies in more than one location.
Hover over each of
the entries in turn. A popup tip shows the path to that file. Decide
which copy is going to be your "working" copy and which will be your
"backup" copy. Don't work in both of them! You can easily find
yourself with two very different versions. So confusing!
![]() Problem: Computer
slows down with two copies of Access open
Problem: Computer
slows down with two copies of Access open
If your computer responds very slowly with a second copy of
Access open, you may not have enough memory to handle two copies at
once. In that case, close the Projects database.
You will create a new Totals query in the MyTrips database and experiment a bit with it. You will make changes to answer the following questions:
- What is the total cost of all the trips?
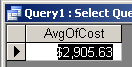
- What is the average cost of a trip?
- What is the total cost of trips by each travel agent?
 In
the Database Window, view the Tables.
In
the Database Window, view the Tables.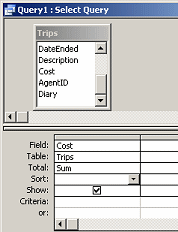 Drag
the Cost field down to the grid and drop it.
Drag
the Cost field down to the grid and drop it.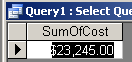
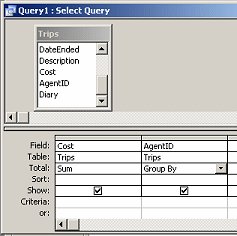
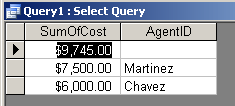 This
time you see values for each travel agent and one for trips when no
agent was used.
This
time you see values for each travel agent and one for trips when no
agent was used.You can combine what you have learned about the Total feature and the IIf conditional expression to create a calculated field that will group your results in a new way. This is starting to get fun! (Or complicated, depending on your point of view!)
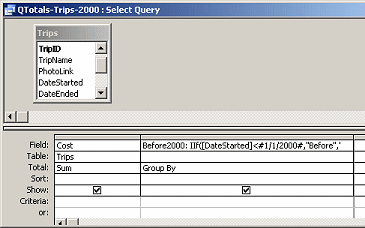
First you will create a Totals query that will Sum the values in the Cost field.
Then you will create a calculated field that will group the trips based
on whether they were before the year 2000 or not.
Syntax for IIF expression:
IIf(<expression to evaluate>, <what to show if
expression is true>, <what to show if expression is false>)
If necessary, open the MyTrips database
again.
 Start
a new query based on the table Trips.
Start
a new query based on the table Trips.
Drag the field Cost
from the list of fields in the Trips table down to the grid.
Show the Totals row, by clicking the Totals
button ![]() .
.
For the Cost column, select Sum for the
Total row.
To create a calculated field, type the following
into the Field row of the second column,:
Before2000: IIf([DateStarted]<#1/1/2000#,"Before","2000
and later")
Be sure to include all of the punctuation, the hash marks (#)
around the date, and the double quote marks around the text strings.
This calculation returns the value "Before" if the DateStarted is before
the year 2000 and a "2000 and later" otherwise.
The Total row shows Group By since that is the default choice.
![]() Run
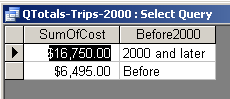
the query.
Run
the query.
The Cost values are added together for two groups, start dates before
2000 and those in 2000 and later.
![]() Save
your query as QTotals-Trips-2000
Save
your query as QTotals-Trips-2000
Close the database MyTrips and then the blank Access window. The Projects database is still open.
|
|
~~ 1 Cor. 10:31 ...whatever you do, do it all for the glory of God. ~~ |
 Example:
Aggregate function - Count
Example:
Aggregate function - Count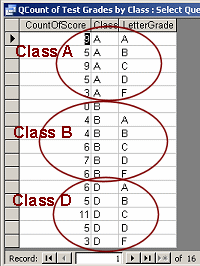 Results: After
running the query, the datasheet shows a
Results: After
running the query, the datasheet shows a