
Jan's Working with Presentations
Advanced: Tables & Charts: Table
Tables do not work particularly well on slides. With even just a few rows and columns a table quickly becomes hard to read. In this lesson you will create a large table on a slide and practice modifying the layout.
What is a table?
A set of rows and columns make up a table. Rows run across the table and columns run from top to bottom. Usually there are column labels at the top and row labels at the left. The intersection of a row and a column is called a cell.
| 1st Qtr | 2nd Qtr | 3rd Qtr | 4th Qtr | |
| East | 20.4 | 27.4 | 90 | 20.4 |
| West | 30.6 | 38.6 | 34.6 | 31.6 |
| North | 45.9 | 46.9 | 45 | 43.9 |
Table Frustration
Working with tables on a slide can be quite frustrating. It is entirely too easy for your table to get larger than the slide or for the text to be too small to read from the audience. Be prepared! It takes a lot of tinkering to get it working right!
![]() Plan ahead! Sketch your table on
paper first. Know how many rows and columns and what size they need to be
before you start. Adding rows and columns later can make text change font
size and even wrap, ruining your careful formatting. Of course you can fix
those glitches, but it can be tricky.
Plan ahead! Sketch your table on
paper first. Know how many rows and columns and what size they need to be
before you start. Adding rows and columns later can make text change font
size and even wrap, ruining your careful formatting. Of course you can fix
those glitches, but it can be tricky.
Methods To Create a Table
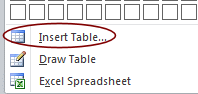
There are three methods to create a new table. All use the Table button on the Insert ribbon tab.
-
 Ribbon: Table Button Palette
On the Insert ribbon tab, click the Table button and drag on the palette. You get a table with evenly sized rows and columns.The default layout formats the top row for column labels. Simple!
Where does the table land?
Empty text placeholder > Table in placeholder
No empty placeholders > Table centered horizontally
below Title placeholder -
Dialog: Insert Table
The dialog Insert Table opens two ways.- Insert Table... command below the palette in the Table button list
-
Table icon in a blank placeholder
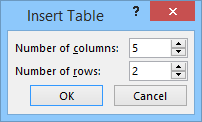 The default table has 5 columns and 2 rows or you can enter the number of columns
and the number of rows that you want. It can be easier than dragging
when you need a lot of rows and/or columns. Of course, it is probably bad design for a slide
to have a table that is as large as 6 columns x 10 rows!
The default table has 5 columns and 2 rows or you can enter the number of columns
and the number of rows that you want. It can be easier than dragging
when you need a lot of rows and/or columns. Of course, it is probably bad design for a slide
to have a table that is as large as 6 columns x 10 rows!
-
 Draw Table:
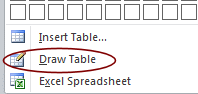 Found on the Table
button's menu and also, after you create a table, on the ribbon tab Table Tools:
Design.
Found on the Table
button's menu and also, after you create a table, on the ribbon tab Table Tools:
Design.
This command turns your mouse pointer into a pencil shape.
 Drag on the slide to draw the outside border of a table. Drag inside a table to draw in the rows and columns that you want.
Advantages:
- Easier to create arrangements of rows and columns with various sizes instead of having to merge cells here and there.
- Easy to split cells, especially if you want varying sizes.
Disadvantages:
- Takes longer to draw a table
- Hard to draw precise widths and heights.
- To edit an existing table by drawing, you may need to change the line style or line color to match your existing table.
Ribbon: Table Tools: Layout
The Layout ribbon tab has controls for selecting, adding, or removing parts of a table and for merging or splitting cells. You can also adjust the size of cells and of the table as a whole and other features of the arrangement of the table.
![]() Row
Height and Column Width: PowerPoint does not have the settings for
these that Word
and Excel have. You must select the cells in the row or column and set the
Cell Height or Cell Width instead.
Row
Height and Column Width: PowerPoint does not have the settings for
these that Word
and Excel have. You must select the cells in the row or column and set the
Cell Height or Cell Width instead.
![]() Deleting: The
DELETE
key will only delete the selected data from the table, not an
actual row or column.
To delete rows or columns you must select what you want to delete and then
use a Delete command from the Table Tools: Design ribbon or from the right click menu.
Deleting: The
DELETE
key will only delete the selected data from the table, not an
actual row or column.
To delete rows or columns you must select what you want to delete and then
use a Delete command from the Table Tools: Design ribbon or from the right click menu.
Resize a Table: Drag
 Dragging on a table's handle will resize the whole table. That will automatically resize the columns and rows.
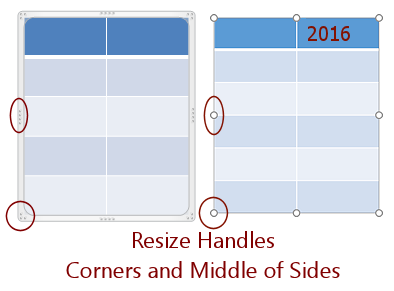
Table Handles:
The resizing handles on a table are marked on the table border with
dots in 2007 and 2010 but with circles in 2013 and 2016.
This border shows when you select the table and is NOT the same as the border that shows on the slide.
Pointer Shape: Resizing table: ![]()
![]()
![]()
![]()
Resize Row or Column: Drag
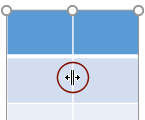
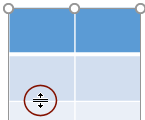 You can resize a row or column without changing the overall table size by dragging the border of the column or row.
Pointer Shape: Resizing rows and columns: ![]()
![]()
Set Exact Size for Table or Cell
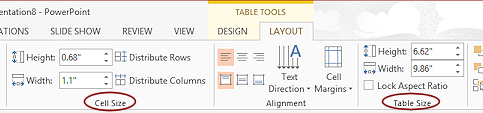
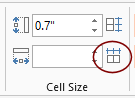
In the Table Tools: Layout > Table Size tab group you can set precise width or height for the whole table. If you check the box 'Lock Aspect Ratio', changing one dimension automatically changes the other.
In the Table Tools: Layout > Cell Size tab group you can set precise width or height for selected cells. Changing a cell's size will also affect its row and/or column.
The buttons 'Distribute Rows' and 'Distribute Columns' make the selected rows or columns of equal size within the current width of the selection.
Pointer
Shape: Selecting a cell, row, column: ![]()
![]()
![]()
![]() Tips about resizing rows and columns:
Tips about resizing rows and columns:
- Changing the height of one cell will change the whole row
- Changing the width of one cell will change the whole column.
- Row height will not go smaller than what is needed for the text's current font size plus a bit of white space around the text.
- Row height will adjust automatically when changing the column width to allow all of the text to show in the cell at the new cell width.
| |
Step-by-Step: Table |
|
| What you will learn: | to add a new slide to add a table to a slide with Insert Table dialog to add a column to resize a column by dragging to size columns equally to add a row to merge cells - Merge button, context menu, Eraser |
Start with: ![]() , nz-animate-Lastname-Firstname.pptx from previous lesson
Animate Images
, nz-animate-Lastname-Firstname.pptx from previous lesson
Animate Images
You will add a large table to a new slide and format it to fit on the slide and be readable. Tricky!
Be aware that your table may not look quite like the illustrations along the way, depending on exactly what you type and how you insert new rows and columns. Also, some steps show only one slide size, 4:3, but PowerPoint 2013 and 2016 use size 16:9, which is wider. So the look on the slide is quite different.
The Story So Far:
You are creating a presentation on New Zealand for World Travel Inc.
to show customers.
You will add a table that shows the average maximum and minimum temperatures for
each season at several places in New Zealand, in both Celsius and
Fahrenheit degrees.
This kind of information is very helpful to visitors.
You do need to know whether to bring a swimsuit or a snowsuit!
Add New Slide
- If necessary, open nz-animate-Lastname-Firstname.pptx from the previous lesson, Animate Images.
-
 Save
As nz-table-Lastname-Firstname.pptx to your Class disk in the powerpoint project3 folder
Save
As nz-table-Lastname-Firstname.pptx to your Class disk in the powerpoint project3 folder -
Select the next to last slide, General Information.
-
 On the Home ribbon tab, click arrow on the New Slide button
  .
.
The palette of layouts opens.
-
Select the Title and Content layout .
A new slide with this layout appears after the selected slide. -
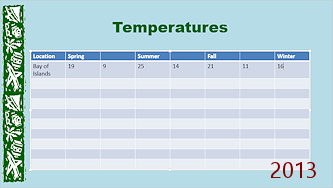
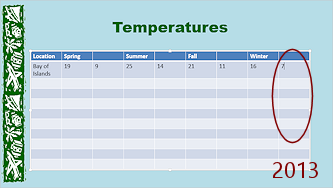
Enter the slide's Title as Temperatures .
-
 Save.
Save.
[nz-table-Lastname-Firstname.pptx]
![]() A
text placeholder shows a bullet but also has icons for objects: Table, Chart, SmartArt, Picture
from file, Clip Art or Online Pictures, Video. If you click on an icon, you open the dialog to
insert this kind of object.
A
text placeholder shows a bullet but also has icons for objects: Table, Chart, SmartArt, Picture
from file, Clip Art or Online Pictures, Video. If you click on an icon, you open the dialog to
insert this kind of object.
![]()
Create Table: Dialog
-
 Click the Table icon
 in the center of the
slide.
in the center of the
slide.
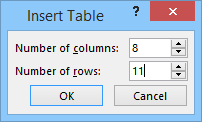
The Insert Table dialog appears.
-
 Change the settings to 8 columns and 11 rows and click on OK.
The table appears on the slide inside the empty text placeholder. It uses the default table style.Yes, this is probably more rows and columns than we should put on one slide! We are going to try it out and see why that is true.
-
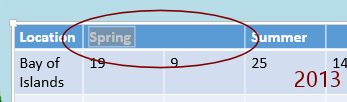
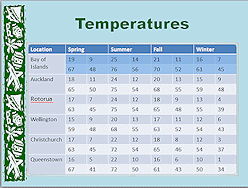
Enter the data for the first two rows:
Location Spring Summer Fall Winter Bay of Islands 19 9 25 14 21 11 16 7 Whoops. You need another column for the 7 plus there are some text wrapping issues already in PowerPoint 2007 and 2010. You will fix that in the next step.
These numbers are temperatures in Celsius degrees and give the average high and average low for the season at that location. So the average high at Bay of Islands in Spring is 19o C and the average low is 9o C. You will be making changes to the table to make it clearer what the numbers mean!
How well does the table fit on the slide? It fills the placeholder.
Are the columns wide enough? There is more width to work with in PowerPoint 2013 and 2016 which has a different default slide size.
-
Save.
[nz-table-Lastname-Firstname.pptx]
Add Column
Using the Table ribbon makes adding columns and rows easy. To add multiple columns or rows, you must select that many first. A bit unexpected.
-
Click in the last column somewhere.
-
On the Table Tools: Layout ribbon tab, click the button Insert Right
 .
.
A new column appears at the right and the original columns resize so that all columns fit inside the original table width.
This is different from earlier versions of PowerPoint where new rows and columns made the table larger.
 Alternate method: Context menu
Right click on the column or row next to where you want the new one. In the context menu, hover over Insert. You have four choices - Insert columns to the left or right, Insert rows above or below. To insert multiple columns or rows:
First select the number that you want to insert and then use the method of your choice. The new rows or columns will appear at the edge of your selection.
-
Fill in the data correctly for the last cell in the second row row by typing a 7.
- Save.
[nz-table-Lastname-Firstname.pptx]The columns labels are wrapping oddly in two spots if your slide is 4:3. You will fix that. This points out the main advantage of wide screen format - more width to work with!
Size Column: Drag
Does your first column need to be wider to hold its contents? Do the temperature columns need to be so wide? They are going to have only 2 digits (no 100's for New Zealand!). That means those columns can be narrower. Let's practice resizing columns.
-
Move your mouse pointer over the right edge of the first column, Bay of Islands.
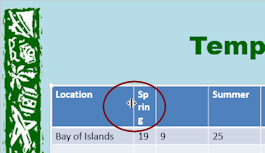
When the pointer turns to
 the Resize Horizontal shape, drag to the right far enough that 'Bay of Islands' fits onto one line. (You have to guess about the distance.)
Widening the first column makes the next column over narrower. The width of the whole table does not change.
The table does not redraw while you are dragging. So you have to guess how far to drag, check the results, and try again!
- Drag the first column's right border back to the left enough to put 'Spring' on one line again.
Be sure that the label 'Location' fits onto one line. 'Bay of Islands' can wrap in its cell.
Adjusting a whole table column by column is not fun. There is another way!
- Save.
[nz-table-Lastname-Firstname.pptx]
Size Column Widths Equally
Before you equalize the widths of the columns, be sure that the table as a whole is the correct width. If you change the size of the table later, you will likely need to equalize the column widths all over again.
-
 Drag across all the cells in any row except the first cell.
The selected cells are highlighted.
-
 On
the Table Tools: Layout ribbon tab, click on
the Distribute Columns button
On
the Table Tools: Layout ribbon tab, click on
the Distribute Columns button 
 .
.
All of the selected columns are now the same width.This might create a new problem with the column labels, but you can fix that later with a different method, merging cells.
- Save.
[nz-table-Lastname-Firstname.pptx]
Add Rows: TAB
Now you can finish entering the data, temperatures in Celsius and in Fahrenheit for each location. You have more rows of data than the table currently has. To add a row at the bottom of the table takes just a simple TAB!
-
Complete the table with the data below.
Use the TAB key to move from cell to cell. Using TAB when you are in the last cell in a row will move you to the first cell of the next row. Handy!
There is a Printable copy of the data if that would be easier to work with.Your table needs more rows to hold all the rows below. After you enter the last temperature on the last existing row, just press the TAB key. A whole new row will appear. So easy!
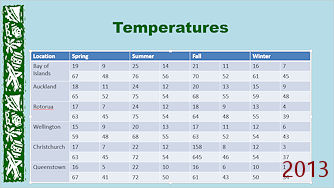
Bay of Islands199251421111676748765670526145Auckland1811241220131596552755468555948Rotorua17724121891346345755465485539Wellington159201317111265948685563525443Christchurch17722121881236345725465465437Queenstown16522101661016741725061435034 Your table is hanging off the bottom of the slide at least a little bit in the 4:3 shaped slide. In a 16:9 slide the table barely fits. Not to worry. You will fix such issues
later. You are not finished messy up this table!
Your table is hanging off the bottom of the slide at least a little bit in the 4:3 shaped slide. In a 16:9 slide the table barely fits. Not to worry. You will fix such issues
later. You are not finished messy up this table!You will find it a regular event to fix it, mess it up, and fix it again when working with tables!
Your table may not look quite like the illustration. It depends on the exact column widths and row heights. Don't worry about it yet!
- Save.
[nz-table-Lastname-Firstname.pptx]
Merge Cells
The season labels should each stretch across two columns, the maximum temperature and the minimum temperature for that season. You can merge the two cells at the top of the columns.
The place names should apply to two rows, temperatures in Celsius and in Fahrenheit. You can merge two cells vertically.
There are three ways to merge cells:
- Button: Merge Cells on the Table Tools: Layout ribbon tab
- Context menu
- Button: Eraser on the Table Tools: Design ribbon tab
You will use all three in the steps below.
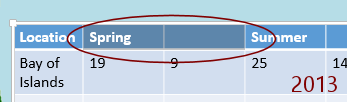 Drag to select the cell with the word Spring and the next blank cell.
The highlighting color varies with the version of PowerPoint. The highlighting can be hard to see with some color choices in the table!
-
 Button: On the Table Tools: Layout ribbon tab, click on
the Merge Cells button
Button: On the Table Tools: Layout ribbon tab, click on
the Merge Cells button  .
.
The label now extends across the space from two cells and the cell border between the original cells vanishes. 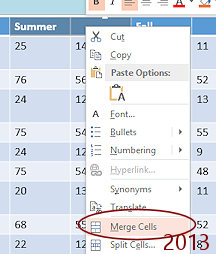 Select the cell containing Summer and its neighbor to the right.
- Context Menu: Right click on the selection and from the context menu select Merge Cells.
- Switch to the ribbon tab Table Tools: Design.
- Eraser:
 Click the Erase button
 .
.
The mouse pointer changes to the eraser shape, .
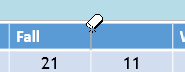
. - Click with the Eraser shape on the border between 'Fall' and the next cell to the right.
The border will turn gray as you click. As you release the mouse button, it vanishes.
The cells are merged.
Of course just because borders don't show does not mean that cells are merged. But the Eraser tool does both - clears the border AND merges the cells. - Press the ESC key or click the Eraser button again to return the mouse pointer to its normal shape.
- Merge the remaining two cells on the top row, using the method of your choice.
 Cells
Resize Automatically: In merging cells, often you wind up with the cell contents using fewer lines than before. (It's one of the primary reasons for merging cells!) The row will automatically resize to hold the cell with the most lines, even if the lines are blank.
Cells
Resize Automatically: In merging cells, often you wind up with the cell contents using fewer lines than before. (It's one of the primary reasons for merging cells!) The row will automatically resize to hold the cell with the most lines, even if the lines are blank. -
 Drag to select the 'Bay of Islands' cell and the blank cell below it.
-
Use the method of your choice to merge the cells.
The row label now can use the space from two cells vertically.The formatting for the top left cell of your selection is applied to all text in the new, merged cell, including the background color.
-
Repeat to merge each place name with the blank cell below it.
The table got shorter! The row labels that were wrapping now have more space in the merged cell. A nice side-effect!Some row labels may still be wrapping oddly. Let's fix that.
-
 If necessary, adjust column widths again: Drag the right edge of the Location column to the right until the place names fit on one line (except for Bay of Islands).
The first column of temperatures may be narrower now than the others.
-
Select cells for temperatures in a row and click the Distribute Columns button again.
You can actually select more than one row or even the whole columns, but it is not necessary. Cells in one row is enough.Your table should now fit onto the slide, though it may be uncomfortably close to the bottom. You will fix that later.
 Problem: Rows are not same height
As you type and edit and your text wraps in different ways, it is easy to get your rows uneven.
Solution 1: Select the cells down a column and then click the Distribute Rows button.
Rows should now be the same height.If the rows are still uneven or seem overly tall, you may have added an extra blank line or two to a cell by accidentally pressing the ENTER key. The row won't resize to hide those extra lines.
Solution 2: Remove extra lines: Click at the end of the text in each cell of rows that are too tall. Press the DELETE key. Once all extra blank lines are removed, the row will resize to the height that holds the text. Are all rows the same height now? If not, try Solution 1 again.
- Save.
[[nz-table-Lastname-Firstname.pptx]
|
|
| © 1997-2017 Jan Smith All Rights Reserved |
Site Map What's New |
Privacy Policy Terms of Service Copyright Acknowledgements |
~~ 1 Cor. 10:31 ...whatever you do, do it all for the glory of God. ~~
Last updated: March 22, 2017