Jan's Working with Presentations
Advanced: Tables & Charts
Many reports and discussions need to refer to tables of information or charts. You will need to think carefully about how or whether to include these in your presentation.
Problems with Tables and Charts
Problem: Too much information all at once means that none of it is absorbed by the audience.
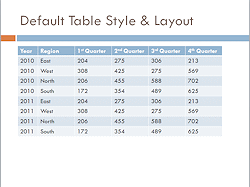 Problem: Tables of data do not show up very well on slides. You
cannot get very many cells on the slide without making them too small to read easily.
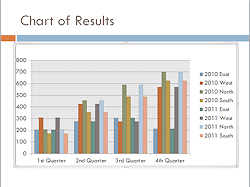
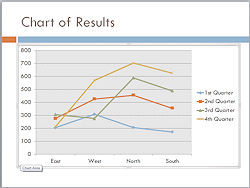
Problem: Complex charts are hard to read on the screen. Text and bars or lines are often quite small.
Possible Solutions:
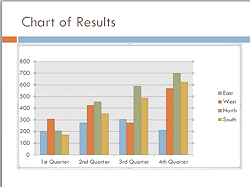 Simplify: Show only the most important data.
- Divide data: Use several simple tables or charts on separate slides
instead putting all in one table or chart.
- Reveal in parts - Table: Create a separate table for each row or
column and arrange them on the slide to look like one table. Use animation to reveal them one at a time.
- Reveal in parts - Chart: Use an animation to reveal each
series or each category in turn instead of all at once, using Effects
Options for the animation.
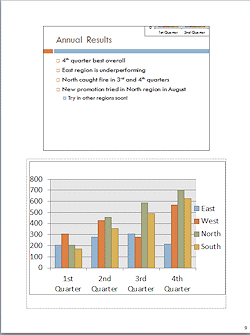 Use Notes
Pages: Put the complete table or chart in a Notes Page handout and
put just a summary
or highlights
on the slide.
Import Data
Problem: Lots of data means lots of typing to create a table or chart!
Solutions (when data is already in another document):
-
Copy and Paste:
Data must already be in a table or chart in another program, like Word or Excel.Advantage:
- It's easy to do.
-
Disadvantages:
- Can be edited only in PowerPoint, with PowerPoint's tools
- Will not show any changes you make to the original later. Is that important?
Import a file as an object:
Insert ribbon tab > Object > From File > Browse to selectAdvantage:
- Can edit with original program.
- If linked, the slide can update to show recent changes.
- Spreadsheet: If the original has several sheets, you can pick which one shows on the slide. The rest is still there if you change your mind!
Disadvantage:
- Broken links: PowerPoint must be able to find the original file when you update. If you moved the presentation to a different computer or moved the data file to a new location, the update will fail.
- Presentation size gets larger when inserting multiple worksheets instead of just a data table or chart.
