Jan's Working with Presentations
Advanced: Tables & Charts: External Data
When you want to use data from an
existing
spreadsheet or document, you certainly don't want to have to type it in all
over again. There are a few decisions you must make.
What Do You Want?
- Part of a document or the whole document?
- Static copy or one that can update to show changes in the original file
- Edit in the original program or as PowerPoint text or object
How to Insert the Data
You have two methods to get external data onto a slide:
-
Copy and Paste
Depending on what you copied, you may have several Paste Options.
Examples:
Cells in a spreadsheet:
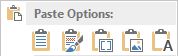
- Use Destination Styles
- Keep Source Formatting
- Embed
- Picture
- Keep Text Only
|
Chart in a spreadsheet:
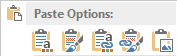
- Use Destination Theme and Embed
- Keep Source formatting and Embed
- Use Destination Theme and Link Data
- Keep Source formatting and Link Data
|
-
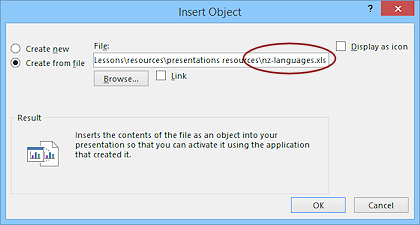
Insert Object 

Insert ribbon tab > Object > Dialog Insert Object
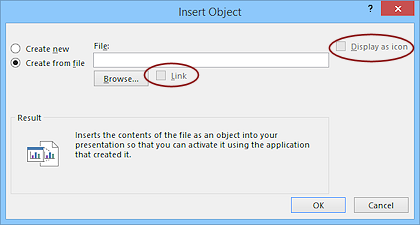
The file is embedded on the slide unless you check one of the boxes.
'Link' puts a picture of the file on the slide.
'Display as icon' put an icon on the slide. While running the slide show, clicking the icon opens the object. The icon is most often used to open another presentation.
Consequences of your choices:
Simple Paste: The pasted data is on the slide, just as if you had typed it.
Embed:
- External data is now included in the presentation file and is not connected to the original file any more.
- Changes on the slide will not affect the original file.
- Changes to the original file will not affect the presentation, including moving, renaming, or deleting the original file.
- Editing what was embedded uses the original program.
Link:
- Changes to the original file will show up on the slide, after you Update Link.
- Changes while in PowerPoint are actually changes to the original file.
Be warned!
- Moving, renaming or deleting the original file breaks the link. You will not be able to edit what shows in PowerPoint
Working with Objects
The context menu for an inserted object will have different commands depending
on exactly what kind
of object it is. For example, your object could be a spreadsheet, a word
processing document, another presentation, or a PDF document. For images it
is better to use the Picture button on the Insert ribbon tab.
Example: Excel Spreadsheet
 An Excel spreadsheet is called a Worksheet Object.
The context menu for this object has a submenu with three choices:
An Excel spreadsheet is called a Worksheet Object.
The context menu for this object has a submenu with three choices:
- Edit
= Edit in place inside the PowerPoint window.
The ribbon changes to show to Excel's ribbon tabs.
- Open = Open in
a new Excel window
- Convert = Change to another format
(requires filters to be installed)
 Must have program to edit: For Edit or Open to work, the computer must have a program installed that can edit the object! For a spreadsheet that would probably be Excel.
 |
Step-by-Step: External Data
|
|
| What you will learn: |
to add external data from a spreadsheet as an object
to select a sheet to display in the spreadsheet object
to resize and move the object
to edit spreadsheet object while still in PowerPoint
to add and format a text box
|
Start with:  , nz-chartdesign-Lastname-Firstname.pptx from previous lesson, nz-languages.xls from your resource files
This lesson assumes that you have some experience with Excel
already.
The Story So Far:
You are creating a presentation on New Zealand for
World Travel Inc.
You will add a information
about what languages are spoken in New Zealand. The main language of New Zealand is
English and most World Travel Inc. customers speak some English, but
English is not the native language for many customers.
A co-worker has found some
tables from the census office in New
Zealand about the languages spoken, but there is more there than anyone probably wants to know! She created
an Excel file, nz-languages.xls, using some of that data. You will import that
spreadsheet as an object and then pick a sheet to show.
-
 If necessary, open nz-chartdesign-Lastname-Firstname.pptx from your Class disk.
-
Add a new slide to follow Rainy Days.
-
Type as the new slide's title Languages .
-
Save As nz-externaldata-Lastname-Firstname.pptx to your Class
disk in the powerpoint project3 folder.
Add External Data
You can place a whole file on the slide. For
Excel files, the sheet you see in the editing window is the sheet that is displayed on the slide.
-
 On the Insert ribbon tab, click on the Object button
  .
.
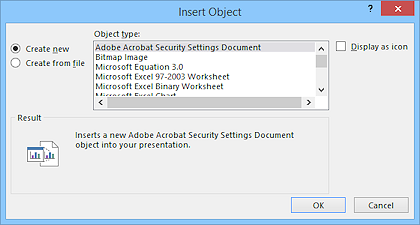
The Insert Object dialog
appears with the option 'Create new' selected.
- Scroll the list of Object types.
These are items for
which PowerPoint can open a program for you to create a brand new document
that will appear in your slide.
-
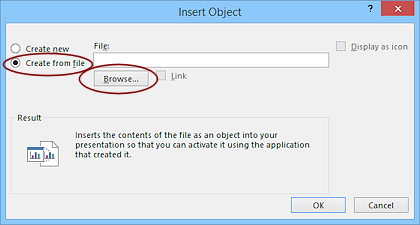 Click on the radio button (circle) for Create
from file.
Click on the radio button (circle) for Create
from file.
The dialog changes! You need the path to the file you want to import.
- Click the Browse Button.
The Browse dialog opens.
-
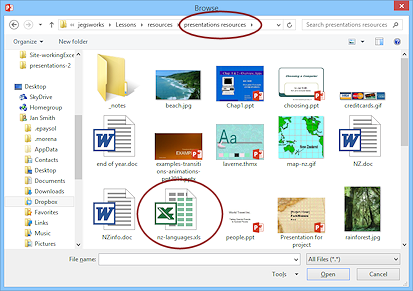 Navigate to the resource files on your hard disk and select
nz-languages.xls
If you have not yet downloaded the resource files, you can download the file from this link:
nz-languages.xls  . Save it to a folder that you can find again and then navigate to it when you browse for the file.
-
 Click on Open or OK.
After a brief wait, the Insert Object dialog changes to show
the path to the file you selected.
The whole path is there, even if it is too long to fit in the text box.
-
 Click on OK.
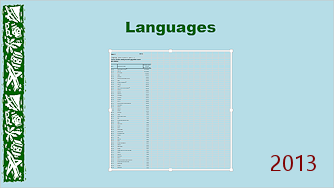
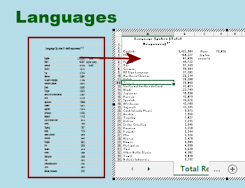
The sheet that was showing when the spreadsheet file was last saved is
displayed on the slide, centered in a placeholder that is now just wide enough to
show the data.
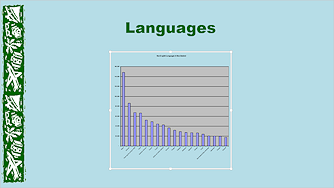
What a horrible table for a slide! Far too many table entries, text is far too
small, too much wasted space on the slide.
Before
making any formatting changes, let's look at this file in Excel and see if there is something
else there that you
can use instead!
 The spreadsheet went into that placeholder because that placeholder was blank.
- Save.
[nz-externaldata-Lastname-Firstname.pptx]
Edit Mode: Resize Object and Navigate
One of the advantages of importing your data as an object is that you can
edit it in place with the original program controls. It's as easy as a double-click!
No
program = No Edit: The program that you want to work with must
be already
installed on the computer!
Undo: Using Undo while in Edit mode for an object will often take you
back further than you meant - to before the object was inserted!
- Double-click the table on the Language slide.
The screen blinks and squiggles a few times and some important things change!
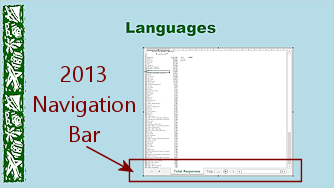
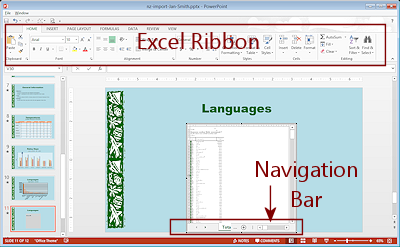 A window appears on top of the slide object, showing the spreadsheet with navigation buttons
at the bottom of the window.
A window appears on top of the slide object, showing the spreadsheet with navigation buttons
at the bottom of the window.- The ribbon changes to Excel's ribbon.
These changes happen only if you have Microsoft Excel installed on the
computer.
The editing window is too narrow to show the navigation controls well.
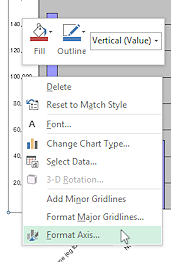
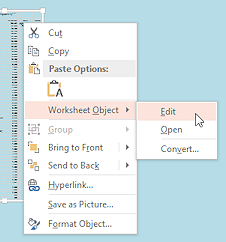 Alternate
method: Right click the table. From the context menu choose Worksheet Object and then Edit.
Alternate
method: Right click the table. From the context menu choose Worksheet Object and then Edit.
-
Resize the editing window on the slide by dragging the handle in the middle of its right side further
to the right.
There is more room for the navigation controls at the bottom now. If you are editing with Excel 2013 or 2016, the editing window must be wider than with other versions for the sheet tabs to show.
If you click on the slide outside the editing window, the window closes and you are back to your slide.
Odd effects:
- Scroll the Excel sheet up and down and also side
to side using the button inside its window.
There is more data at the bottom but not over to the
side.
-
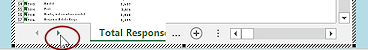 Click twice
on the right arrow in the navigation bar at the bottom of the
spreadsheet to see the third sheet tab.
Click twice
on the right arrow in the navigation bar at the bottom of the
spreadsheet to see the third sheet tab.
The spreadsheet is
probably too narrow to read the full chart names.
-
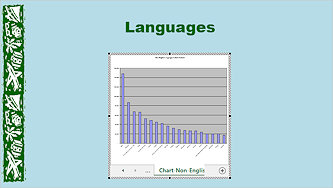 Click on the last tab, Chart-Non-English Languages.
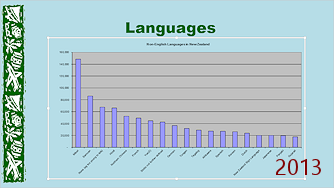
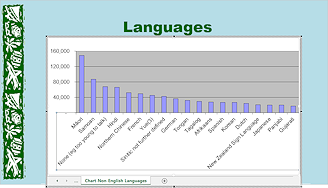
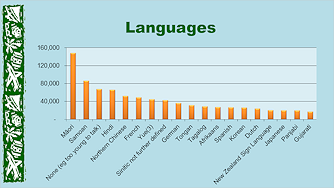
The
display changes to show the chart sheet. You need to resize and position this object!
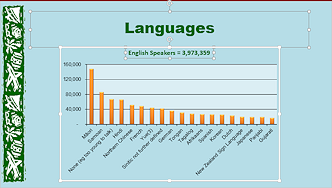
This chart shows the number of people in New Zealand who use the listed languages. English is not on the chart. It's column would be so tall that the others would be hard to see.
-
Save.
[nz-externaldata-Lastname-Firstname.pptx]
Your chart may not look exactly like
the illustrations on this page. It depends on exactly how wide you
drag the Excel window.
Move and Resize Object
Moving an object around on the slide while still in Edit mode is
tricky and often makes a mess. It is wiser to do the sizing and
positioning outside of Edit mode for the object.
-
 Click on the slide outside
the spreadsheet object.
Click on the slide outside
the spreadsheet object.
Wow! The placeholder resizes and
centers itself on the slide! That was a surprise!
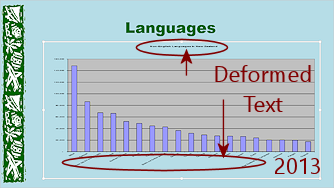 Drag handles to resize the object to be about the size of the original placeholder.
Whoops. The text deforms!
- Undo.
-
 Resize the chart using the corner handles to as large as will fit.
Your slide may not look quite like the illustration which has a wide screen slide size.
 Problem: Chart is more square than oblong
Solution: Return to the editing window (Double-click the chart) and resize the window to a fairly large oblong. Then click out again. Sometimes this works and sometimes it doesn't.
The
text is still far too small. It's time to start making changes.
- Save.
[nz-externaldata-Lastname-Firstname.pptx]
Edit Object
While your object (the spreadsheet) is in the editing window, you can make changes.
Since you did not Link this object back to the original file, your changes
don't affect the original at all. You are free to play!
When you are in Edit mode for the object, the ribbon changes to the
ribbon for the original program. In this lesson that is Excel. Don't get
confused when that ribbon looks different! The formatting choices are
very similar to those in PowerPoint.
-
 Double-click the chart to return to Edit Mode
for the object.
Double-click the chart to return to Edit Mode
for the object.
The window for the sheet chart changes size and
falls off the slide at the bottom.
DO NOT try to resize the
window at this time. The size on the slide is NOT the size in this window. Wait until you are finished editing to see if
you really need to resize.
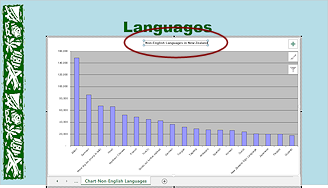
- Click on the chart title, Non-English Languages in New
Zealand, to select it.
-
Press the DELETE key.
The Title text box
vanishes.
You can make the axes easier to read by changing the font and removing some of
the numbers.
-
 Right
click on the number labels for the vertical axis.
Right
click on the number labels for the vertical axis.
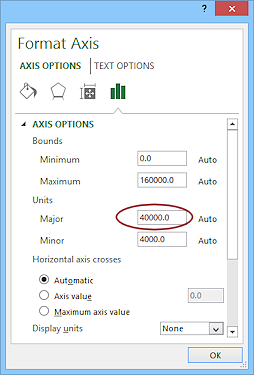
The Format
Axis dialog or pane opens.
There are many pages of options here but most are not
that useful for this part of the chart.
- In Axis options, change the major unit to 40000.
- Click on Close or OK to apply this change.
 On
the Home ribbon tab while the axis labels are
still selected, change the Font Size to 20.
On
the Home ribbon tab while the axis labels are
still selected, change the Font Size to 20.
Now you can read the numbers!
-
Click on the language names across the bottom (the
horizontal axis) change the Font Size to 20.
Problem:
Cannot see the language names across the bottom
If you cannot click on the horizontal axis labels, you cannot change the font
size! If you try to scroll to
see them, you will probably slip over to the next slide. So frustrating!
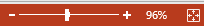 Solution: Change the PowerPoint Zoom setting (bottom right of
the PowerPoint window) to make the
slide smaller in the Slide Pane.
Solution: Change the PowerPoint Zoom setting (bottom right of
the PowerPoint window) to make the
slide smaller in the Slide Pane.
- Click on a column in the chart.
The whole series shows resize handles on the corners, which means
that the columns are selected.
-
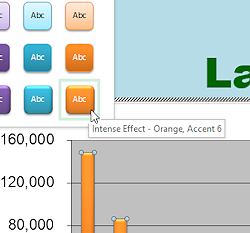 On the Chart Tools: Format ribbon
tab, open the palette of Shape Styles and select the bottom right effect, Intense Effect, Orange, Accent 6.
On the Chart Tools: Format ribbon
tab, open the palette of Shape Styles and select the bottom right effect, Intense Effect, Orange, Accent 6.
-
 Click in the Plot
Area to select it.
Click in the Plot
Area to select it.
- On the Chart Tools: Format ribbon
tab, click on the Shape Fill button
to open the palette of colors.
- Click on the color Aqua,
Accent 5, Lighter 80%.
The area behind the columns changes
color.
-
 Click outside the chart object to return to PowerPoint.
If you are paying close
attention, you may catch a glimpse of the old chart still on the slide before
it update to match the changes you made.
The chart area resizes so
that the axes labels will show at the new font size. The text is still on the
small side but at least there is a chance your audience can read the language
names now!
Did the width change when you went back to
PowerPoint? This is common. It is SO confusing when what you see while editing is not
quite what you see on the
slide!!
-
If necessary, resize the chart to the largest that will keep the text on the slide and leave some space below the slide title.
Your chart may be
proportioned differently depending on exactly what you did and in
what order.
- Save.
[nz-externaldata-Lastname-Firstname.pptx]
Add Text Box and Format
The chart does not include the number of people who speak English. The column
for English would be so tall that the other columns would be impossible to read!
You can add that information in a text box, as a kind of subtitle for the
slide.
-
 Create Text Box: On the Insert ribbon tab, click the Text Box button
  .
.
When you move your mouse over the slide, the pointer changes to  vertical bar with a small
crossbar near the bottom.
vertical bar with a small
crossbar near the bottom.
- Click underneath the Title placeholder. A small text box appears with the cursor in
it, ready for your typing.
- Enter Text: Type: English Speakers = 3,973,359
With this method, the text box will be
exactly wide enough to hold your
text.
-
Format the text:
Font Size = 20
Color = Dark Green (in the Recent Colors. Same color as the
slide title)
Bold
The text box is probably not centered under the title, depending on exactly where you clicked
to create it.
-
 Alignment: While the new text box is selected...
- Hold the SHIFT key down and then...
- Click on the Title placeholder and then click on
the chart.
All three objects are now selected together.
-
 On the Drawing Tools: Format ribbon tab, click the Align button and then click on Align
Center.
On the Drawing Tools: Format ribbon tab, click the Align button and then click on Align
Center.
The Title placeholder, the text box, and the chart line up neatly
with their centers over each other.
- Click onto a blank area of the slide to deselect the objects.
- Save.
[nz-externaldata-Lastname-Firstname.pptx]
- Play the Slide Show starting with this slide.
Hmmm. The title and chart are animated, using the Slide Master settings, and appear after the slide transition. But
the text box appears when the slide shows up. Perhaps you can fix this unhappy
state in the next lesson.
Evaluate
 Is the chart working
well on this slide? What was the purpose for this presentation? Will this slide help
accomplish that purpose?
Is the chart working
well on this slide? What was the purpose for this presentation? Will this slide help
accomplish that purpose?
The font size 20 is
OK for viewing on a monitor. It may be too small to do much good on a
projection screen in a large room.

 Two copies?
If you move or resize the editing window, you may see the placeholder underneath. Remember that Edit Mode opens a new window on top of the slide.
Two copies?
If you move or resize the editing window, you may see the placeholder underneath. Remember that Edit Mode opens a new window on top of the slide.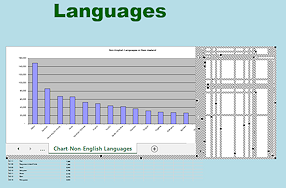 Weird display: Dragging the placeholder larger while in Edit Mode may confuse the computer's display. You may see extra lines inside the editing window.