
Jan's Working with Databases
Intro: Spreadsheet Database
A spreadsheet can work as a flat file database IF one row holds all the data for one record.
Other rows on the worksheet can be used for text or calculations or other data, but each database record must have its fields in a single row.
Limits: A spreadsheet has a maximum number of rows and columns. Excel 2007, 2010, 2013, and 2016 allow 1,048,576 rows by 16,384 columns which is a lot more than the 65,536 rows and 256 columns allowed in Excel 2003. Either one sounds like a lot! But, Excel will get rather slow long before reaching the maximum number of records.
Some programs, including Excel 2007, 2010, 2013, and 2016, call such a database a table. Earlier versions of Excel called it a list.
![]() Your spreadsheet program probably will not treat
the data as a database until you tell it to do so.
Your spreadsheet program probably will not treat
the data as a database until you tell it to do so.
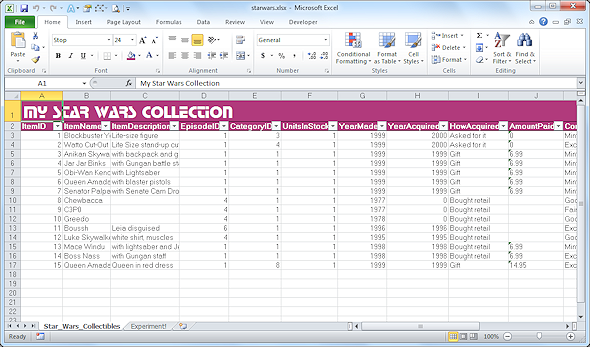
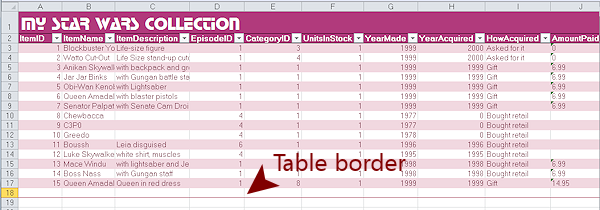
Example: A database in Excel, which calls it a table.
We will now look at the example Excel spreadsheet to see how a spreadsheet database can work. The illustrations and directions are for Excel 2010. Older versions of Excel work differently, as do other spreadsheet programs.
Database = Table in Excel
This page will assume that you are already familiar with the style of interface that uses ribbons, which are used in Excel 2007, 2010, 2013, and 2016.
Turning cells into a table in Excel
- Select the cells that are to be your table.
Include a blank row at the bottom to make it easier to add new rows.
- Verify that the selected rows are each a single record.
- On Excel's Insert ribbon tab, click the Table button

What will change when Excel turns your data into a table?
An Excel table has some handy features. If you have some experience with Excel, you will appreciate the changes.
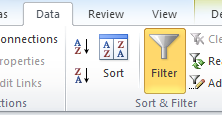
- Column headings get an arrow to open a menu for sorting and filtering,
which highlights the Filter button.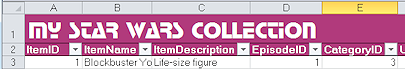
Sort: .
 You can sort the table based on values in only one column at a time. Pick alphabetical or
numerical order (Sort Smallest to Largest) or reverse order (Sort Largest to Smallest). Any cells on the sheet that are NOT in the table will not be sorted.
You can sort the table based on values in only one column at a time. Pick alphabetical or
numerical order (Sort Smallest to Largest) or reverse order (Sort Largest to Smallest). Any cells on the sheet that are NOT in the table will not be sorted.How to tell that data is sorted:
- The arrow in the column heading changes to
 or
or  to show the sort order. Look carefully!
All of the fields in a record in the table move together. We don't want to move some fields and leave behind others from that same record!
Only the cells you included into the table move. Data in other cells on the worksheet or even other tables on the same worksheet will not be affected by what you do to the active table.
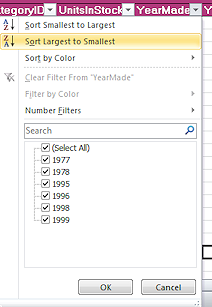
Example: Choosing Sort Smallest to Largest from the menu for the column YearMade will reorder the rows in the table so that the values in this column are in numerical order.
 Sort on
multiple columns with Sort dialog:
Sort on
multiple columns with Sort dialog: 
Use the Sort button on the Data ribbon tab to open the Sort dialog to do a custom sort using multiple columns. You can sort with up to 64 columns! The table column headings can only sort on one column at a time.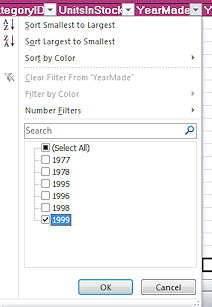 Filter:
You can filter the records to show just certain records, by choosing one or more values from the menu of options.For example, in the menu of options for Year Made, if you click on (Select All) to deselect the choices and then click on 1999, only the records that have 1999 in this column will show. But the others are not really gone! They are just hiding.
 How to tell data is filtered:
 - The arrow in the column heading changes to the filter symbol
 .
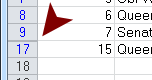
. - The row heading numbers at the left show gaps in the numbering, which tells you that some rows are temporarily hidden.
- The row heading numbers for table rows are blue instead of black while the table is filtered.
-
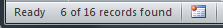
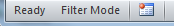
The Status Bar shows a message like "6 of 16 records found" or "Filter Mode".
 Filters
add together: After you have filtered once, choosing
a value from another column's list of values does not remove the
previous filter. It filters the current, previously filtered records. You are filtering
what has already been filtered.
Filters
add together: After you have filtered once, choosing
a value from another column's list of values does not remove the
previous filter. It filters the current, previously filtered records. You are filtering
what has already been filtered. - The arrow in the column heading changes to
Marking what's included in the table
- There is a tiny blue end-of-table mark
 in the bottom right cell of the table cells.
 -
Formatting from a table style.
Most table styles show alternating row background colors and a thin border around the table.
- There is a tiny blue end-of-table mark
-
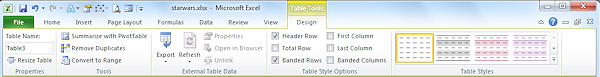
Table Tools: Design ribbon tab
 The
Table Tools: Design ribbon tab appears when the table is active because a table cell is selected. However, the tab does not automatically become the active tab.
The
Table Tools: Design ribbon tab appears when the table is active because a table cell is selected. However, the tab does not automatically become the active tab. Convert to Range button
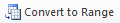 changes your table back
to normal cells.
changes your table back
to normal cells.
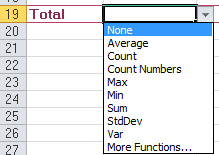
Show a Total Row:
 Check or uncheck the box to show or hide a row for column Totals.
The 'total' does not have to be a sum. You can also average or count or use any other Excel function. Each cell in the Total row shows an arrow for this list when the cell is selected.
Do It! with Excel on your computer
Would you like to see a spreadsheet database at work?
If you have installed software that will open an Excel spreadsheet, click the image below to open the example spreadsheet. Depending on your browser and security software settings, you will may need to save the file first. Then you can open the file in an appropriate program.
![]()
![]() Click the image to download an example:
Click the image to download an example:
Star Wars Collection spreadsheet - starwars.xlsx
![]() Experiment! Play around with it. We will not explore Excel
in depth here but it is good to see what can be done with a plain spreadsheet.
Experiment! Play around with it. We will not explore Excel
in depth here but it is good to see what can be done with a plain spreadsheet.
Try the following activities in the spreadsheet:
(The directions below are also on the sheet named Experiment in the spreadsheet.)
- Sort using various columns.
- Return to original order: Use Undo or Sort Smallest to Largest
on first column, ItemID.
- Filter to show only items made in 1999 using the menu of options for the column YearMade. Click on Select All to unselect all of the choices and then click on 1999.
[The Status bar should now show '8 of 16 records found'.]
- Add a filter to the previous results to show items that were a
Gift, using the column HowAcquired.
[There are now 6 records.]
- On the ribbon tab Table Tools: Design, check the box to add a Totals row.
- In the Totals row, scroll right and click in the cell in the column
Condition Details. An arrow appears.
Click the arrow and choose COUNT.
The cells now shows the total number of non-blank cells in the column, as currently filtered.
[There are 5 records that have an entry in this field.]
- In the Totals row, use the SUM function to add up the column Amount
Paid.
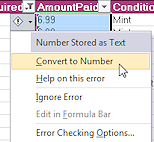 [The sum
will be zero! The prices are being treated as text instead of numbers.
Select the numbers in this column and click the button that appears
[The sum
will be zero! The prices are being treated as text instead of numbers.
Select the numbers in this column and click the button that appears  , Error Checking.
Select Convert to Number from the menu.) Now the sum is 49.9]
-
Remove all the filters: On the Data ribbon tab, click the Clear Filters button
 .
.
[The sum of Price Paid column does not change! The prices that were hidden by the filter are still text.]Note: If you click the Filter button on the Data ribbon tab, the filters are all removed and the arrows in the headings vanish, too. The cells are still in a table and any sorting you have done remains.
-
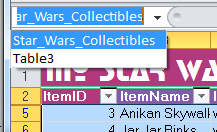 Select
all the database cells from the list of named cells at the upper left
of the worksheet. The name is Star_Wars_Collectables. (This is the easy way to select the original rows. The
name of the sheet was added automatically to the drop list!)
Select
all the database cells from the list of named cells at the upper left
of the worksheet. The name is Star_Wars_Collectables. (This is the easy way to select the original rows. The
name of the sheet was added automatically to the drop list!)
- Back to normal cells: Select a single cell in the table. From the Table Tools: Design ribbon tab, click on the button Convert to Range. The sort/filter arrows vanish but the Total row and its values remain.
 ? Your instructor may want you to print a copy of changes along the way.
![]() Evaluate:
How easy is it to work with a spreadsheet database?
Evaluate:
How easy is it to work with a spreadsheet database?
Is it easy to create a new record?
To view a whole record?
Missing Features
If you try to work with a spreadsheet as a database for very long or with one that has a large number of fields, you will want to be able to do things that are hard or impossible to do.
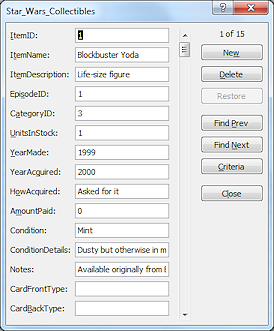 Forms: Excel 2007, 2010, 2013 and 2016 allow you to create, view, and edit records using a form. This form puts all of the fields for one record in view at once as a single column of text boxes.
Too many fields means that Excel will refuse to create the form. I was able to get a form that had 31 fields.
You cannot edit the form's layout at all. The scroll bar moves you through the various records.
Forms: Excel 2007, 2010, 2013 and 2016 allow you to create, view, and edit records using a form. This form puts all of the fields for one record in view at once as a single column of text boxes.
Too many fields means that Excel will refuse to create the form. I was able to get a form that had 31 fields.
You cannot edit the form's layout at all. The scroll bar moves you through the various records.
Unhappily, the command for a form is not on any of the default ribbon tabs. You can add it to the Quick Access toolbar from the Commands Not in the Ribbon. In Excel 2010, 2013, and 2016 you can also add the command to a custom tab group or a custom ribbon tab. Apparently Microsoft found that forms for spreadsheet tables were not being used by very many people.
Reports: If you wanted to print a neat report from a spreadsheet database, you have to export the data to another program. This is not a priority for spreadsheets!
Queries: It is common to want to filter and sort your record in a fairly complex way based on comparing fields to each other or to particular values. Excel cannot handle these easily.
If you want to know more about spreadsheets, there is a complete set of
lessons in Jan's
Illustrated Computer Literacy = Working with Numbers ![]() .
.
|
|
| © 1997-2017 Jan Smith All Rights Reserved |
Site Map What's New |
Privacy Policy Terms of Service Copyright Acknowledgements |
~~ 1 Cor. 10:31 ...whatever you do, do it all for the glory of God. ~~
Last updated: March 27, 2017