
Jan's Working with Numbers
Glossary
If you don't see the term you are looking for, use your browser's Find command to search for it. Perhaps your term is used in a definition.
Each term is linked back to the appropriate lesson. If you don't see the term on that page, use your browser's Find command to search for it.
# or symbol
A B C D E F G H I J K L M N O P Q R S T U V W X Y Z
# or Symbol
- #####
- Error code - The column is too narrow to show the complete number.
- #DIV/0!
- Error code - Formulat attempted to divide by zero.
- #NAME?
- Error code - Formula used an undefined name for a range or a function. Either the name was mis-typed or the range with that name was deleted. The semicolon in a range reference is easy to mis-type or omit.
- #REF!
- Error code - Cell references are incorrect. Either the cell reference was mis-typed, like 3A instead of A3, or the cell was deleted or the formula is in a range used in the formula (circular reference).
- #VALUE!
- Error code - The value in a cell used in a formula is of the wrong type, like text when a number is needed.
A
- absolute reference
- Cell reference which will not change if the formula is moved. Has the format $A$1.
- active
- The cell which receives the action or keystrokes. It has a wider, dark border.
- adjacent
- Adjacent parts are next to each other.
- argument
- A value needed to calculate a function. For example, the function COUNT needs cell references as the arguments:
- Example: =COUNT(A2:D6) or =COUNT(B1, C2, D3, D4, F5).
The IF function has 3 arguments - the logical test, the value if the test is True, the value if the test is False.
Example: =IF(G4>4000, G4, "Too small") which produces the value from G4 if that value is greater than 4000 but shows the text "Too small" if it is not. - assumed values
- The values that are fixed in formulas on a sheet, like interest rate or commission rate.
- AutoCalculate
- A special feature of Excel which shows a calculation on the Status bar. You may select from several, including SUM and COUNT.
- AutoComplete
- A feature of Excel which automatically completes certain words or phrases.
- AutoCorrect
- Excel automatically changes some of your typing. You can use this feature to automatically replace a short string of text with a longer one, like typing the initials of a long name and having AutoCorrect replace the initials with the long, complete name.
- AutoFill
- A feature of Excel which automatically copies a cell into cells that are dragged across, or which automatically continues a pattern of values in cells that are dragged across.
- AutoFit
- Clicking the edge of a column heading or a row heading makes the column or row as wide or tall as needed to show contents of the cell that needs the most space
- AutoSum
- A button which sets a formula to add up cells either in a row or in a column. Excel guesses which one you want. You can easily change the cells that the formula will use.
- Axes
- Edges of a chart which are marked off in even sections
B
- Backstage view
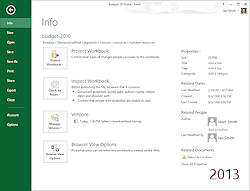

 Excel 20010, 2013: The File tab opens Backstage view, which contains a list of commands that apply to the document as a whole. Selecting a command changes what the right side of the window shows.
C
- cell
- The intersection of a row and a column
- cell padding
- The space between the cell border and the text or numbers in the cell.
- cell reference
- The columns letter followed by the row numbers, like A1 or BC575.
- cell style
- A combination of formats that is named and can be used again for other cells.
- characters
- A measurement of column width using the average width of the characters in the current font.
- chart
- A picture that shows how numbers relate to each other. Column, Line, and Pie chart styles are the most common.
- chart area
- The area that contain all of the parts of the chart, including the titles and legend.
- chart tips
- Popup tips that tell what each part of a chart is or its values.
- chart title
- The title assigned to the chart, usually at the top.
- chart type
-
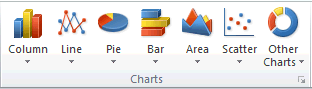 Type of chart, like column, pie, area, donut,
etc.
Type of chart, like column, pie, area, donut,
etc. - circular reference
- A formula that uses the cell reference of the cell that the formula itself is in.
- Clear
- A command that opens a menu of choices or what you want cleared: All, Formats, Contents, Comments.
- clear data
- Erase data from a cell. Formatting is still assigned to the cell and will be used for any new data. Clearing the data does not delete the cell itself, just the contents.
- clear formats
- Returns the selected cells to the default formatting.
- Collapse Dialog button
- A button which collapses the dialog to show just a text box for cell references. Clicking or dragging in the spreadsheet puts those cell references in the text box.
- collapse group
- In a
subtotals sheet, clicking the
 Collapse button will remove from view the rows in
that level of the sheet
Collapse button will remove from view the rows in
that level of the sheet - column
- A vertical set of cells, running from the top of the sheet all the way to the bottom of the sheet
- column chart
- A chart
which displays the data as a set of columns.

- column heading
- A button which shows the letter name of the column.
- column label
- A title that you enter in a cell for a column of cells.
- column width
- The horizontal size of a columns of cells.
- Comma
- A button on the ribbon which will apply the comma number format to selected cells. In this format, groups of 3 digits to the left of the decimal point are separated by commas and 2 digits are shown to the right of the decimal point (with location United States in Windows' Region and Language settings).
- comment
- A note attached to a cell. The default is a pale yellow rectangle. A comment can be hidden. The shape can be changed to any AutoShape. Text in a comment can be formatted. Comments are used to explain something about the source or formatting or use of the cell contents.
- comment indicator
- A small red triangle in the upper right corner of a cell indicates that there is a comment attached to the cell.
- concatenation
- Combining text and values into one text string. If the formula in cell D10 is ="Final Total is " + C4 + " ." and the value of cell C4 is 560, then what you see in cell D10 is The Final Total is 560.
- conditional formatting
- Formatting that changes based on a logical test. Fonts, borders, and fills can all be changed.
- context sensitive
- A menu or ribbon tab that is available only when the object those commands apply to is selected. For example Chart Tools only appear if a chart is selected. Or, the right click menu has commands to edit or delete a comment only when the cell you click on has a comment.
- convert
- To change the type of object or file. You might convert a Lotus 1-2-3 worksheet to a Microsoft Excel worksheet or to a picture.
- Copy
- To duplicate a cell, row, column, or range to another area of the worksheet or to a different worksheet.
- Currency
- A button on the ribbon which applies the Currency number format to the selected cells. In this format numbers have a symbol for the particular currency chosen, such as $ or €. Two digits are shown to the right of the decimal point.
- custom list
- A sorting list that you create yourself.
- customize ribbon
- In Excel 2010 and 2013 you can add a custom tab to the ribbon or a custom tab group to an existing tab. You cannot change the tabs and tab groups and buttons that come with Excel.
D
- data block or region
- A set of cells that contain data of some sort and which are surrounded by blank cells on all sides.
-
- data group
- A set of cells which are related. Often formatted differently from other daata groups.
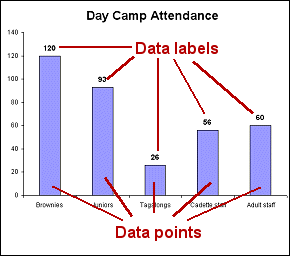
- data labels
- Words or numbers that are near a data point on a chart to explain it
- data point
- A single value on a chart, represented by a dot,
bar, area, or pie wedge.
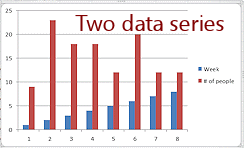 data series
- A set of data points that are part of a sequence.
- data table
- A table of values used in the chart that is attached to the chart.
- data validation
- Testing to see if the data makes sense. For example checking that a termination date comes after the hiring data or that a zip code has the correct number of digits.
- Decrease Decimal
- A button on the ribbon which changes a number's format to show one fewer digits to the right of the decimal point.
- documentation
- Description of what you did and why for the source, purpose, and design of your document. For Excel it may be important to explain a formula and what cells are linked. Documentation contained in the document somewhere does not get lost!
E
- edit data
- To change existing data.
- edit in place
- To edit an object without having to switch to another program.
- Edit mode
- When in Edit mode, you can type directly in the cell instead of having to use the Formula Bar. Turn on Edit mode by double-clicking the cell you want to edit. The Status Bar shows 'Edit' when this mode is on.
- embedded object
- A document or part of a document from one program that appears inside a document from another program. The embedded object does not show changes in the source document unless you manually update it.
- End mode
- Pressing the End key turns on End mode, which changes the action of certain keys.
- enter data
- Typing and then pressing the ENTER key or clicking the check mark button makes the cell remember what you typed. To make changes after the data has been entered, you must edit or else your new typing will replace what was in the cell.
- Indicator
- A green triangle in the upper left corner of a cell. Click the cell to see a smart button which will explain what the error is.
- expand group
- In a subtotal sheet clicking the
 Expand button brings into view that level of the
sheet.
Expand button brings into view that level of the
sheet. -
 explode (pie chart)
 - Move the wedges that make up the pie away from each other.
F
- fill handle
- a small black square at the bottom right corner of a selection
- fill series
- Dragging the fill handel of a selection to enter values in the cells over which you drag, using a pattern established by your selection.
- filter
- A set of criteria, or rules, that hides data which does not match. The data is not deleted.
- Flash Fill
- Excel 2013: Uses one or more examples to complete a column when the contents are based on cells in neighboring columns. For example, Flash Fill can finish the work of combining columns to create a single complete name, like John E. Smith when you already have columns for the name parts. Or you can use Flash Fill to pull out only a part of a cell's contents, like an area code or the zip code or just the last name.
- footer
- The placeholder at the bottom of a printed page or of a slide that can hold text that you want to appear on every page of the print-out using that layout or on every slide using the current slide master.
- formula
- An expression that calculates something, usually based on the values in cells. The formula = SUM(A1, B1, C1) adds the values in the three cells. The formula =D2/G4 divides the values in cell D2 by the value in cell G4.
- Format Cells...
- Command that opens the Format Cells dialog, which has 6 tabs for choosing the formatting for the cell and its contents.
- Format Painter
- Clicking the Format Painter button changes the pointer to the
Format Painter shape
 .
The formatting of the current cell is copied. When you click on
another cell, the copied formatting is applies.
.
The formatting of the current cell is copied. When you click on
another cell, the copied formatting is applies. - Formula Bar
- A text bar at the top of the sheet. It shows what the currently selected cell contains. If the selection contains several cells, the Formula Bar shows what is in the upper left cell. If a cell's value is calculated with a formula, the Formula Bar shows the formula but the cell shows the value, unless you are in Edit mode.
- Freeze panes
- A command on the Window menu which makes the rows and columns above and to the left of the selected cell "freeze" in place when you scroll the window.
- Full screen
- A view which maximizes the amount of screen available for the sheet by hiding the ribbon and Status bar.
- function
- a mathematical expression. In the case of spreadsheets, a function always starts with the equals sign, =.
-
Examples: =SUM(e12:h22) =COUNT(b14:g36) =AVERAGE(A4,A6,A12,A42)
G
- goal seek
- A What-If spreadsheet that is set up for you to enter a goal value and then change other values to find out what you need to meet or exceed your goal. For example, if you want to save $5000, you would enter $5000 as your goal and tinker with the amount of time and the amount saved out of each pay check to find combinations that would save up that amount.
- gridlines
- The gray lines which outline the rows and columns on a sheet.
- group (data)
- To gather similar data together, such as moving rows with the same value in a certain column next to each other
- group (sheets)
- Selecting several worksheets at once groups the sheets, shown by the sheet tabs turning white. Actions done to one sheet are done to all sheets in the group.
-

H
- header
- The special placeholder at the top of a printed page that can hold text that you want to print on every page of the handouts or on every Notes page.
- headings
- The buttons with letters across the top and with numbers down the left side of a worksheet. They name the column or row. Clicking a heading selects the whole column or row.
I
- icon link
- A small icon that links to another document. Used in a document instead of embedding or linking
- IF function
- Syntax: =IF(logical comparison, value
if the comparison is TRUE, value if the comparison is FALSE)
Example: =IF(C4>D4, C4-D4, "Smaller") This function does the subtraction if the first value is the larger one. If it is not, then the text "Smaller" is the result instead of a number. - import filter
- Translates what you are trying to paste or insert into your document from another type of program into a form that the current program can work with.
- Increase Decimals
- A button which formats numbers show one more digit to the right of the decimal. Rounded numbers will be rounded again to the new number of digits. A zero will be added if the number was not rounded to start with. For example, the number 2.5 would display as 2.50 if the actual number really is 2.5 exactly. If the actual number was 2.4789, then after clicking Increase Decimal, the new value will look like 2.48.
- input message
- A popup message that explains what you should enter in the current cell. For example, the message might show that the format for a phone should be like 123-456-7890
- insert
- To add rows or columns or cells in between existing ones, moving existing data out of the way.
J
K
L
- label
- Sheet: A cell that has text which identifies the data in that row or column.
- Chart: Text or numbers that identifies data, such a a pie wedge or a column, gives its actual value or percentage of the whole.
-
 legend
 - A list of the colors or symbols for different series on a chart
- link
- To connect cells on two different sheets so that data entered or calculated on one appears on the other.
- linked object
- An object that displays and prints in a document but is actually just a link to another document. A linked object always shows the latest version of the source. The source must be available, however, for this to happen.
- logical comparison or test
- Compares two values with a logical operator, like =, < , and > or the combinations <=, >=, <>. The result of a
logical test is either True or False.
A logical comparison can compare numbers to each other or text strings to each other. For example, 'Fred' < 'Ginger' would be True because Fred comes earlier in alphabetical order. The IF function uses a logical comparison to decide which of two actions to perform, one if the comparison is true and a different one if it is false.
M
- Merge and Center
- A command which merges selected cells and centers the data in the merged cell.
- merge cells
- Combines two or more selected cells into one cell. The data in the upper left cell of the selection is all that is saved into the new larger cell. All the other cells' data is lost.
- Message area
- The section of the Status Bar for displaying messages about what is going on
- mode
- In different modes the keys perform different actions.
- mode indicators
- A symbol or abbreviation that shows what mode is currently on.
- move
- To move data to another area of the sheet or to a different sheet.
N
- name
- A cell can have a name as well as a cell reference
- Name Box
- A text box at the upper left of the sheet which displays the cell reference of the currently selected cell or it's name, if it has one.
- non-adjacent
- Not right next to each other.
- Normal View
- The default view for a sheet, with the gray gridlines.
O
P
- Page Break Preview
- A view which shows clearly what parts of a sheet will print together on the same piece of paper. You can drag the outlines to keep certain areas from printing at all.
- A dialog which has 4 tabs for managing the printing of a spreadsheet: Page, Margins, Header/Footer, Sheet
- Page Layout view
- Shows the sheet on pages of paper, similar to Print Preview, but you can edit in Page Layout View.
- Page Setup
- A dialog which lets you manage the paper pages of a print out. You can set margins, scaling, paper orientation, what goes in headers and footers, and which rows or columns to print on every page, and more.
- Paste Link
- A command that pastes copied data as a link. When the original cells change, so will the pasted ones.
- Paste Special
- A command that opens a set of choices for how you want to paste what you copied. For example, you can paste just the values or just the formats.
- Percentage
- A button on the ribbon which applies the Percentage number format to the selected cells. No decimal places are shown by default. The number 3.456 would be converted to 346%.
- picture object
- An object inserted into a document which is just an image of the source document. It can be edited only as an image.
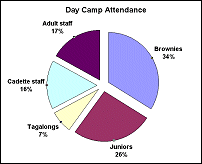
- pie chart
- A chart which displays the data as parts of a whole circle.

- pin
- To require a document in a list of recently used items to stay in view, regardless of how recently it has been viewed.
- pivot chart
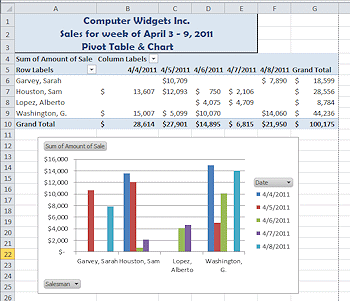 An interactive chart showing data from a pivot table. The
chart includes drop lists for filtering what shows.
An interactive chart showing data from a pivot table. The
chart includes drop lists for filtering what shows. - pivot table
- An interactive table that shows a sum, count, average, or other function result at the intersection of a row and column. Example: Showing total sales where the rows are salesmen and the columns are dates. The table includes drop lists for choosing what shows.
- plot area
- The part of a chart that shows the data - bars, dots, lines, pie shape.
- A button which will cause the entire sheet to print, including cells that have no data but which were formatted.
- Print Area
- The part of a sheet will actually print out.
- Print as displayed
- Choice on Sheet tab of Page Setup for Excel. Applies to cell comments. When chosen, the comments are printed however they show on the screen.
- Print at end
- Choice on Sheet tab of Page Setup for Excel. Applies to cell comments. When chosen, the comments are printed all together at the end of the sheet's pages.
- Print formulas
- Display the formulas in cells with Tools| Options | Show
formulas. Then print.
- Print dialog
- A dialog with which you can manage the actual printing process: choose a printer, access printer options, choose which pages to print, choose how many copies to print
- Print Preview
- A view that shows how the sheet will look after printing.
- Print Titles
- A choice in the Page Setup dialog that repeats the columns and/or rows that you name (the 'titles' for your data) on every page when you print a sheet.
Q
- Quick Access Toolbar
- A toolbar at the top left of the window with buttons for commonly used actions.
You can add others that are useful to you using the More button at the end.
R
- range
- A set of adjacent cells. The range reference has the form C3:E6 and refers to cells in the rectangle with C3 and E6 at opposite corners: C3, C4, C5, C6, D3, D4, D5, D6, E3, E4, E5, E6.
- Regional Settings or Region & Language
- An icon on the Control Panel opens a dialog which lets you choose a language and country for your regional settings. This affects what Windows and programs use as a unit of measure for distances and currency and also how dates and times are displayed.
- relative reference
- A normal cell reference (like C3) is a relative reference. When a cell is moved, any formulas that refer to that cell are changed to use the new location.
- Restore Dialog button
- Restores the dialog that was collapsed with the Collapse Dialog.
- ribbon tab
 One of several part of the ribbon of controls and commands across the top of the window. The active tab has a border, like the tab on a file folder. Some tabs appear only when needed, like Chart Tools or Drawing Tools.
- row
- A set of cells that runs across the page to the last column.
- row heading
- A button which shows the number of the row
- row height
- The height of the cells in the row. All cells in the same row must have the same height.
- A title which you enter for the row, often in the first cell in the row.
- row label
- Text in a cell that is a title for the contents of that row.
S
- Scroll Lock mode
- When the Scroll Lock key is pressed, certain keys start different actions.
- selection
- The cell or cells that will receive the actions of keys and commands. The selection is surrounded by a wide dark border.
- series
- Two or more cells whose contents form a pattern. AutoFill can continue the series.
- sheet
- Short for worksheet
- sheet tab
- An area at the bottom of a sheet that shows the name of the sheet.
- shift data
- When copying and pasting, you may be asked if you want to shift the data down or to the right. Enough cells are moved over for the pasted cells to fit.
- slicer
- Excel 2010, 2013: A table of values that you can use to
filter a pivot table and pivot chart. It makes it clear what
your filters are.
- Smart Tag
- Marks something that has a special menu of options.
- sort
- To rearrange rows of data in an order. The order can be alphabetical, numerical, or based on a custom list.
- Sort Ascending or Sort A-Z
- A button which will sort selected cells in a column into alphabetical or numerical order. If multiple cells are selected in each row or whole rows are selected, the sorting is based on the first cell in each row of the selection.
- Sort Descending or Sort Z-A
- A button which will sort selected cells in a column into reverse alphabetical or numerical order. If multiple cells are selected in each row or whole rows are selected, the sorting is based on the first cell in each row of the selection.
- Sort dialog
- A dialog which offers more choices than the Sort buttons. You can sort on 3 different columns. For each one you can choose to sort ascending, descending, or use a custom list.
- split cell
- To divide a cell into 2 or more cells.
- Split view
- A view which allows you to see 2 or 4 parts of the sheet at the same time
- spreadsheet
- Sheet or worksheet- formed of rows and columns.
- standard width
- The default width for a column.
- Subtotal
- A total of part of a larger set of data, usually of a certain group.
T
- table
- A set of adjacent cells that were selected in order to format or filter or sort.
- table style
-
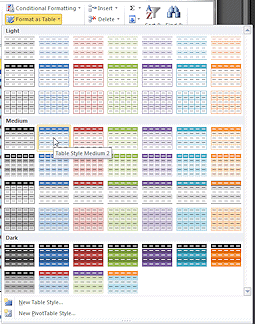 A
set of formatting choices to turn a range of cells into a
'table' where each column has an arrow to open a set of sorting
and filtering commands.
A
set of formatting choices to turn a range of cells into a
'table' where each column has an arrow to open a set of sorting
and filtering commands. - task pane
- A pane added to the window for a particular task. For example the Clipboard pane shows what the Office clipboard currently rememnbers.
- theme
- A saved set of formatting choices - colors, fonts, effects, presentation backgrounds. An Office theme can be used by any Office program.
- title
- The contents of a cell which label the sheet.
U
- Unfreeze panes
- The command on the Window menu which makes the whole sheet scroll together.
- ungroup (sheets)
- To separate grouped sheets. Click on a sheet that is not in the group, or right click on the group and select Ungroup from the popup menu
- Unmerge
- To return merged cells to their previous arrangement. Data that was lost in the merge is still lost.
- update
- To fetch the current values for data that is linked from another document.
V
- value
- Part of a function, such as an IF function where you must state what value you want the cell to show if a condition is met and if it is not met. The value can be a number, text, or a cell reference.
W
- What-If sheet
- A spreadsheet that is used to try out various combinations of numbers to see what how the results change.
- workbook
- The file that is an Excel document. Usually it contains several worksheets
- workbook window
- The document window in Excel
- worksheet
- A single spreadsheet page. It may take several sheets of paper to print since one can be as large as 1,048,576 rows by 16,384 columns
- workspace
- The area below the ribbon that holds your document.
X
- .xls
- The file extension used for Excel spreadsheets for versions before Excel 2007/2010/2013.
- .xlsx
- The file extension used for Excel spreadsheets for Excel 2007/2010/2013.
Y
Z
|
|
| © 1997-2017 Jan Smith All Rights Reserved |
Site Map What's New |
Privacy Policy Terms of Service Copyright Acknowledgements |
~~ 1 Cor. 10:31 ...whatever you do, do it all for the glory of God. ~~
Last updated: March 22, 2017