|
Step-by-Step: Format Data Groups
|
|
|
What you will learn:
|
to format data group background
to merge duplicate data
to move a table
to create a drop shadow |
Start with:
 trips23.xls - Specials sheets
(saved in
previous lesson)
trips23.xls - Specials sheets
(saved in
previous lesson)
You will format the data to emphasize the sorting categories and to spotlight the grand totals.
You may need the original data later, with no formatting or cute layout
tricks. You will work with a copy of the sheet.
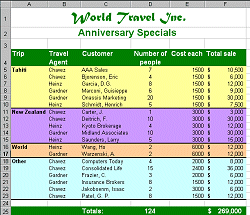
To visually separate the groups of trips, you will apply a fill color to the whole group, and a border below the last row in the group. Since the name of the trip is repeated for each record, you can merge those cells and show the trip name just once for the whole group. To make the grand totals more visible, you will move the second table to the left and down.
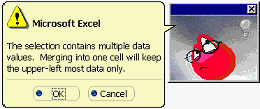
There are disadvantages to merging duplicate cells. It may
make creating charts more difficult. You cannot sort again without splitting the
merged cells and replacing the lost data.
Copy Sheet
- Select the sheet tab for Specials. Right click on it
and select
- In the Move or Copy dialog, check the box to Create a copy. In the first text box
select trips23.xls and in the second
select from the drop list Tahiti. Click OK.
A new sheet named Specials (2) appears at the
between Agent Totals and Tahiti.
- Rename this sheet Formatted Groups . Having your data in its original state can save a lot of time and aggravation if you decide that your groupings were not such a good idea. It's another safety net.
Format Group: Fill, Border, Merge Duplicates
You will format the new sheet and leave the original data in place.
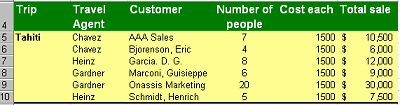
- On the sheet
Formatted Groups, select cells A5:F10, which are the records about
Tahiti trips.
-
 Apply a
Light Yellow fill using Fill Background button on
the Formatting bar.
Apply a
Light Yellow fill using Fill Background button on
the Formatting bar.
- Apply a thick bottom border with the Border button on the Formatting bar.
- Select cells A5:A10, which all contain the word Tahiti.
- Select | and on the Alignment tab choose
Merge cells and set Vertical alignment to Top.
- Click on OK to close the dialog and click on OK on the message about losing cell contents when merging.
-
 Make Tahiti
Bold
Make Tahiti
Bold
- Repeat the procedure for the New Zealand trips, using a different color,
Lavender.
[Select cells A11:F15 and apply a fill color of Lavender and the same bottom border. Select cells A11:A15 and merge with Vertical alignment as Top. Make New Zealand Bold.]
- Widen column A to show all of the text "New Zealand".
- Repeat the procedure for World, using another color, Tan.
[Select cells A16:F17 and apply a fill color of Tan and the same bottom border.
Select cells A16 and A17 and merge with vertical alignment as Top. Make World Bold.]
-
 Repeat the procedure for Other, using yet another color,
Light Turquoise.
Repeat the procedure for Other, using yet another color,
Light Turquoise.
[Select cells A18:F23 and apply a fill color of Light Turquoise and the same bottom border.
Select cells A18:A23 and merge with vertical alignment as Top. Make Other Bold.]
Format Sheet: Move Table
- Select the second table, in the range C28:G38.
- Drag the selection left and down to A35.
- Check Print Preview. Now the grand totals on row 25 are more noticeable and both
tables still fit on one page.
- Close Print Preview.
Format Title
- If necessary, show the Drawing toolbar.
- To make the titles stand out a bit more, select cells A1 and
A2 and on the Drawing bar apply a drop shadow
 - down and right.
The text Anniversary Specials is a bit close to the
bottom.
- Drag the heading for Row 2 down to a height of 30.00.
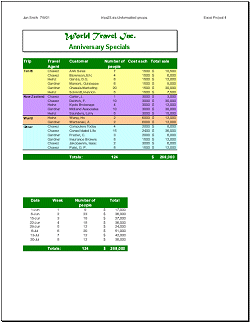
- Select cell A2 and set the vertical alignment to Top. (Format | Cells… | Alignment)
- Check the Print Preview again. Then close
Print Preview.
- Save as
trips24.xls .
 How to handle a full disk