Dragging on a table's handle will resize the whole table, causing rows
and columns to change size to fit inside the new table size.
 |
Step-by-Step:Create a Table |
|
What you will learn: |
to insert a new slide
to add a table to a slide
to format table text
to add columns and rows
to size columns and rows
to distribute space evenly among columns or rows
to insert a symbol (for degree)
to stop AutoFit
to format table borders |
Start with:  ,
nz-animate.ppt from previous lesson
Animate Images
,
nz-animate.ppt from previous lesson
Animate Images
You will add a large table to a new slide and format it to fit on the
slide and be readable. Tricky!
Be aware that your table may not look quite like the illustrations
along the way, depending on exactly what you type and how you insert new
rows and columns.
The Story So Far:
You are creating a presentation on New Zealand for World Travel Inc.
to show customers.
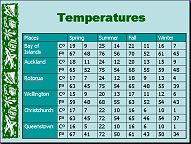
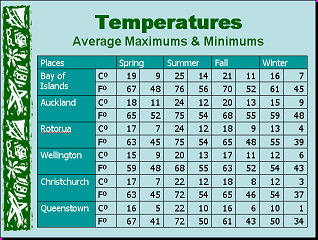
You will add a table that shows the average maximum and minimum temperatures for
each season at several places in New Zealand, in both Celsius and
Fahrenheit degrees.
This kind of information is very helpful to visitors.
You do need to know whether to bring a swimsuit or a snowsuit!
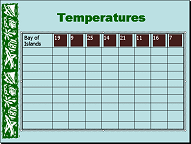
Add New Slide
-
If necessary, open
nz-animate.ppt from the previous lesson,
Animate Images.
-
Select the next to last slide,
General Information.
-
Click the New Slide button
 on the Formatting Bar. A new slide appears after the selected
slide.
on the Formatting Bar. A new slide appears after the selected
slide.
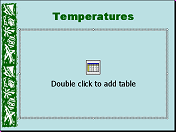
-
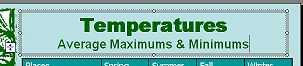
Enter the slide's Title as Temperatures
.
-
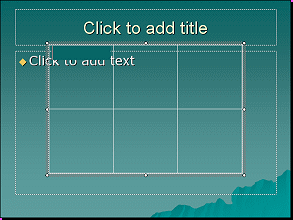
 Apply
the Title-Table layout
Apply
the Title-Table layout
 .
.
The text placeholder changes to a table
placeholder.
 Any slide layout that includes an
object like a clip art image, table, or chart will have an icon in the
placeholder. You can double click the icon to go straight to the process
for creating or adding such an object. Some layouts give you a choice of icons:
Any slide layout that includes an
object like a clip art image, table, or chart will have an icon in the
placeholder. You can double click the icon to go straight to the process
for creating or adding such an object. Some layouts give you a choice of icons:
 table, chart, clip art, image from file, diagram, media clip.
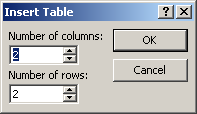
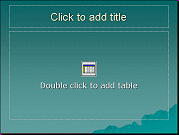
Create Table
-
Double click the icon in the center of the
slide. The Insert Table dialog appears.
-
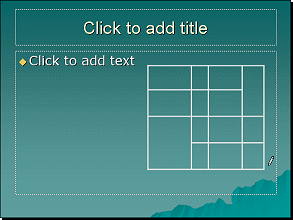
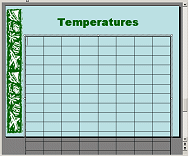 Select
8 columns and 11 rows. The table appears on the slide, but
some rows are hanging off the bottom of the slide. After you enter data, you will have to resize the
rows and columns.
Select
8 columns and 11 rows. The table appears on the slide, but
some rows are hanging off the bottom of the slide. After you enter data, you will have to resize the
rows and columns.
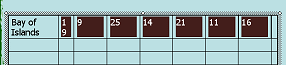
-
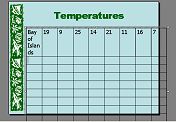
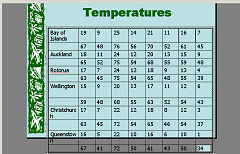
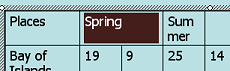
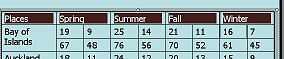
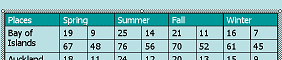
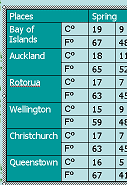
In the first row, enter the data:
|
Bay of Islands
|
19
|
9
|
25
|
14
|
21
|
11
|
16
|
7
|
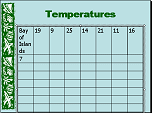 These numbers are temperatures in Celsius degrees.
Whoops. You need another column for the 7.
-
Save
As nz-table.ppt to your Class disk.
 How to handle a full Class disk
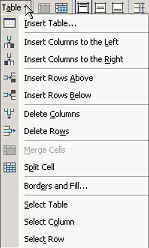
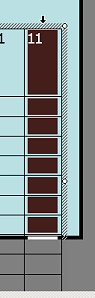
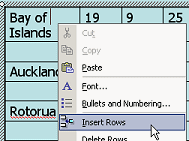
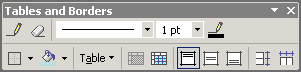
Add Column
Using the Table menu makes adding columns and rows easy. To add multiple
columns or rows, you must select that many first. A bit unexpected.
-
Click in the last column somewhere.
-
From the Table menu on the
Tables and Borders Bar, choose . A new column appears at the right, expanding the
table off the slide.
If you
select several columns first, using this command will produce as many
columns as you had selected.
 Alternate: Right-click
Menu to Add Column:
Alternate: Right-click
Menu to Add Column:
Move your mouse over the top of the last column until the pointer changes
to
 the Select Column shape. (This can be tricky! It may be easier if the
table is not already selected.) Click. The whole column is selected.
the Select Column shape. (This can be tricky! It may be easier if the
table is not already selected.) Click. The whole column is selected.
 Right click on the selected column and choose
from the popup menu.
Right click on the selected column and choose
from the popup menu.
A new blank column appears to the left of the selected column.
-
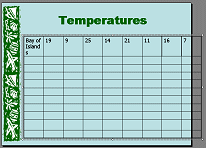
 Fill in the data correctly for the first row.
Format Table Text
Clearly the default font size is too large for your table.
You can change that before you do any more data entries.
-
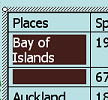
Select
the entire table by clicking the table border. The border changes to small
dots.
-
 Change
the Font Size to 20 on the Formatting Bar.
Change
the Font Size to 20 on the Formatting Bar.
Better since the rows are all now on the slide. But will you need more rows??
Are some of your rows different heights? You will fix that later.
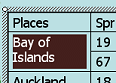
Size Column: Drag
Your first column needs to be wider to hold the place name.
The temperatures are going to have only 2 digits (no 100's for New Zealand!) so
those columns can be narrower.
-
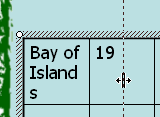 Move
your mouse pointer over the right edge of the first cell,
Bay of
Islands.
Move
your mouse pointer over the right edge of the first cell,
Bay of
Islands.
-
When the pointer turns to
 the Resize Horizontal shape, drag to the right.
This makes the next column over smaller. The width of the whole table does
not change. You will have to resize the table yourself and
then balance the widths of the other columns.
Size Column Widths Equally
Before you equalize the widths of the columns, you need to
get the table back onto the slide.
-
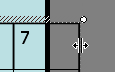 Move
your mouse pointer to the right edge of the table until the pointer
turns to
the Resize Horizontal shape.
Move
your mouse pointer to the right edge of the table until the pointer
turns to
the Resize Horizontal shape.
-
Drag to the left until the table is back onto
the slide. Your last cell may be too small to show the number. That's OK for
now.
-
 Drag
across all the cells in the first row except the first one.
Drag
across all the cells in the first row except the first one.
The selected cells are highlighted.
If your last cell is very narrow, you may
not be able to see the highlight in that cell.
-
 Click
on
Click
on
 the Distribute Columns Evenly button on the Tables and Borders Bar.
All of the temperature cells are the same width now.
the Distribute Columns Evenly button on the Tables and Borders Bar.
All of the temperature cells are the same width now.
Add Rows: TAB
You have more rows of data than the table has. To add a row
at the bottom of the table takes just a simple TAB!
-
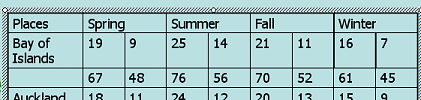
Complete the table with the data below.
Use the TAB key to move from cell to cell. Using TAB when you are in the last
cell in a row will move you to the first cell of the next row. Handy!
Printable copy of the data
Your table is a row short. After you enter the last temperature on the last
existing row, just press the TAB key. A whole new row will appear. So easy!
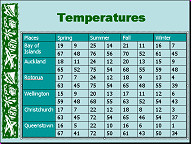
|
Bay of Islands
|
19
|
9
|
25
|
14
|
21
|
11
|
16
|
7
|
|
|
67
|
48
|
76
|
56
|
70
|
52
|
61
|
45
|
|
Auckland
|
18
|
11
|
24
|
12
|
20
|
13
|
15
|
9
|
|
|
65
|
52
|
75
|
54
|
68
|
55
|
59
|
48
|
|
Rotorua
|
17
|
7
|
24
|
12
|
18
|
9
|
13
|
4
|
|
|
63
|
45
|
75
|
54
|
65
|
48
|
55
|
39
|
|
Wellington
|
15
|
9
|
20
|
13
|
17
|
11
|
12
|
6
|
|
|
59
|
48
|
68
|
55
|
63
|
52
|
54
|
43
|
|
Christchurch
|
17
|
7
|
22
|
12
|
18
|
8
|
12
|
3
|
|
|
63
|
45
|
72
|
54
|
65
|
46
|
54
|
37
|
|
Queenstown
|
16
|
5
|
22
|
10
|
16
|
6
|
10
|
1
|
|
|
67
|
41
|
72
|
50
|
61
|
43
|
50
|
34
|
Your table is hanging off the bottom of the slide. Not to worry. You will fix that
later. You will find it a regular event to fix it, mess it up, and fix it
again!
Add Rows: Menu
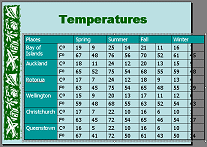
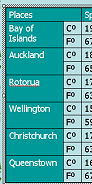
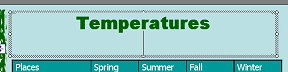
This table should really have column labels, otherwise these numbers
make no sense. You will now add a row at the top of the table for labels.
-
 Right
click on a cell in the top row.
Right
click on a cell in the top row.
- Choose from the popup menu.
A new blank row appears above the row you clicked on.
Alternate Method to Add Rows:
Table Menu - Click in a cell in a row next to where you want the new row.
From the Table menu, select either
or
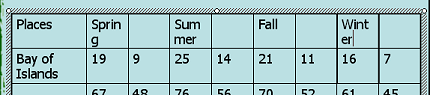
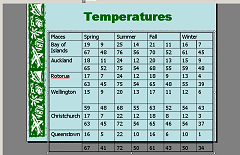
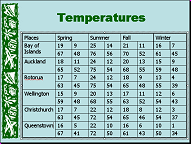
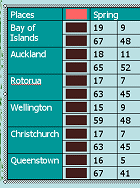
- Enter labels for Place, Spring, Summer, Fall, Winter as shown in
the illustration below.
Merge Cells
The season labels should apply to two columns, the maximum temperature and
the minimum temperature for that season. You can merge the two cells at the top of the columns.
The place names should apply to two rows, temperatures in Celsius and in
Fahrenheit. You can merge two cells vertically.
-
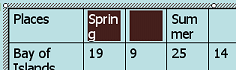 Drag
to select the cell with the word Spring and the next blank cell.
Drag
to select the cell with the word Spring and the next blank cell.
-
 Click
on
Click
on
 the Merge Cells button on the Tables and Borders Bar. The label now extends
across the space from two cells.
the Merge Cells button on the Tables and Borders Bar. The label now extends
across the space from two cells.
- Repeat to merge two cells for the labels Summer, Fall,
and Winter.
-
 Drag
to select the Bay of Islands cell and the blank one below it.
Drag
to select the Bay of Islands cell and the blank one below it.
-
 Click
on
the Merge Cells button on the Tables and Borders Bar. The label now can
use the space from two cells vertically.
Click
on
the Merge Cells button on the Tables and Borders Bar. The label now can
use the space from two cells vertically.
- Repeat to merge each place name with the blank cell below it. You
will not see your highlighting clearly for cells that are off the slide.
- Adjust column widths again: If necessary, drag
the right edge of the Places column to the right until the place names fit
on one line (except for Bay of Islands). Then make the temperature columns
equal widths again by selecting cells and clicking the Distribute Columns
Evenly button again.
Size Row: Drag
Are some of your rows still off the slide? To make the table shorter, you
must resize the rows. Resizing rows can be quite frustrating!
The steps below fix two types of problems but your table may be just fine.
- If a row seems too tall (like the first Queensland row
in the illustration above), move the mouse pointer over
the bottom edge of the row. When the pointer changes to
 the Resize
Vertical shape, drag up. PowerPoint will reduce
the height to the minimum for the current font size.
the Resize
Vertical shape, drag up. PowerPoint will reduce
the height to the minimum for the current font size.
 Problem:
Can't resize extra height
Problem:
Can't resize extra height
If there are spaces or line breaks or paragraph breaks in any cell
in the row, you can not drag the row to the minimum height
for the visible data. You must remove the trouble-causing items first. Unlike in
Word, there is no way to show the marks for these! You must be a detective
to find them.
-
 If
a row is still not short enough after dragging its border (like the
first Wellington row in the illustration above), put your cursor in each
cell in the row in turn and drag through the cell, but do not
drag into a neighboring cell. Highlighting will appear where there are
spaces or line breaks or paragraph breaks.
If
a row is still not short enough after dragging its border (like the
first Wellington row in the illustration above), put your cursor in each
cell in the row in turn and drag through the cell, but do not
drag into a neighboring cell. Highlighting will appear where there are
spaces or line breaks or paragraph breaks.
- Use the DEL or BACKSPACE keys to remove any extra
spaces, line breaks, or paragraphs.
When all cells in the row have been fixed, the row height should
automatically shrink to fit the font size.
- If your table is still not quite on the slide, drag
 the bottom center handle upward until it is.
-
Save to your Class disk.
[nz-table.ppt]
How to handle a full Class disk
Size Row Heights Equally
Small differences in row height will be more noticeable when your slides are
projected. It is easy to make the rows all the same height once those hidden
marks are removed.
- Select all the cells in a column.
- Click on
 the Distribute Rows Evenly button on the Tables and Borders Bar. The height
inside the table is divided equally among all the rows.
the Distribute Rows Evenly button on the Tables and Borders Bar. The height
inside the table is divided equally among all the rows.
Formatting
Labels often have a colored background or a different font than the
table text.
-
 Select the
top row
of the table.
Select the
top row
of the table.
-
 Open
the palette of colors from
Open
the palette of colors from
 the Fill Button on the Tables and Borders Bar.
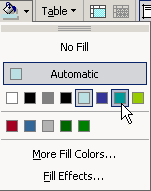
- Select the teal from the color scheme colors, second from
the right.
-
 With
the row still selected, similarly apply White as the font color,
using the Font Color button on the Formatting Bar.
With
the row still selected, similarly apply White as the font color,
using the Font Color button on the Formatting Bar.
- Repeat the actions above for the place names in the first
column.
Format Painter will
copy the text formatting but it will not
copy the background fill.
Add Column After Formatting
The table is still not completely clear. You need to show which temperatures
are in Celsius and which are in Fahrenheit. It will be a tight squeeze, but it can be
done!
-
 Click in the first cell under Spring, with the number 19 in it.
- From the Table menu on the Tables and Borders Bar, select
. A new column
appears with the same formatting as the column your cursor was in.
- Merge the Places cell with the new cell in the top row.
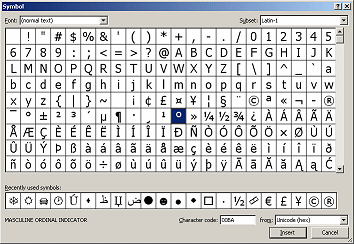
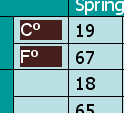
Insert Symbol
The symbol for degrees, a raised circle like º, is not on the normal English
keyboard. You can insert it, and many other special characters, by using the Symbol
dialog.
- In the 2nd cell of the new column, first type C
.
-
 From the menu
select |.
From the menu
select |.
- Click on the small raised circle in the middle of the
palette of characters.
- Click the Insert button in the dialog. Nothing seems to
happen. The dialog remains open in case you want to insert more characters.
-
 Click
the Close button in the dialog. Now you can see the degree symbol next
to your C.
Click
the Close button in the dialog. Now you can see the degree symbol next
to your C.
- In the next cell down type F° .
(The º symbol will be in the display of Recently used symbols at the bottom of
the dialog.)
-
 Drag
to select the two cells you just typed in.
Drag
to select the two cells you just typed in.
- Click the Copy button
 .
.
- Click in the next blank cell in the column and paste.
The data you copied is pasted into the next two cells.
-
 Repeat
to copy your Cº and Fº into the remaining blank cells.
Repeat
to copy your Cº and Fº into the remaining blank cells.
Now your temperature data is clearly labeled but the table is off the slide to
the right... again!
Adjust Table and Columns
You may need to adjust and readjust the table size and column widths to get the
table back onto the slide and the data columns equal again. Such an
aggravation! Fixing one problem creates other problems.
-
 Adjust
the width of the new column until the Cº and Fº just fit onto one line.
Adjust
the width of the new column until the Cº and Fº just fit onto one line.
-
 If
necessary,
drag the center handle on the right edge (small white circle) on the right side of the table back
to the left until the table is back on the slide.
If
necessary,
drag the center handle on the right edge (small white circle) on the right side of the table back
to the left until the table is back on the slide.
This will resize all the
columns again and probably make the place names run over onto two lines again.
<sigh>
-
 Resize the
Places and C/F columns, if necessary, so that the text
fits on one line (except for Bay of Islands).
Resize the
Places and C/F columns, if necessary, so that the text
fits on one line (except for Bay of Islands).
-
Distribute Columns Evenly: Select the data cells in a row and use the
Distribute Columns Evenly button again.
-
Save to your Class disk.
[nz-table.ppt]
How to handle a full Class disk
 If
you insert a special character and the computer that is running your
presentation does not have the same font that you used, you may see a
completely different character instead. Not all fonts include all of the
characters that other fonts have. This is a good reason to embed your fonts
with the presentation.
If
you insert a special character and the computer that is running your
presentation does not have the same font that you used, you may see a
completely different character instead. Not all fonts include all of the
characters that other fonts have. This is a good reason to embed your fonts
with the presentation.
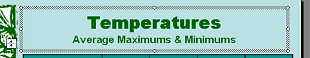
Insert & Format Text
This slide still does not tell the viewer that these temperatures are
maximums and minimums. There's no more room in the table! You can put this
information in the Title, but you will have to format carefully to make it all
fit.
-
 Click
in the Title at the end of the word and press the ENTER key.
Click
in the Title at the end of the word and press the ENTER key.
The font size of the title drops one size to 40. A new line appears that will
use the same formatting. Too tall for a subtitle!
-
 Change
the font size to 24.
Change
the font size to 24.
- Change the font to Arial.
- Type as the new subtitle Average Maximums &
Minimums
Note the AutoFit icon
 at the left of
the Title placeholder. AutoFit automatically reduced the font size of the main
title when you pressed ENTER so that the text would all fit in the
placeholder. Now that you have changed the font size, a larger size would be
OK for the main title.
at the left of
the Title placeholder. AutoFit automatically reduced the font size of the main
title when you pressed ENTER so that the text would all fit in the
placeholder. Now that you have changed the font size, a larger size would be
OK for the main title.
-
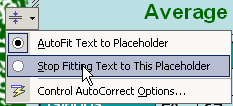 Hover
over the AutoFit icon until an arrow appears. Click the arrow. A menu
appears.
Hover
over the AutoFit icon until an arrow appears. Click the arrow. A menu
appears.
- Choose Stop Fitting Text to This Placeholder.
 The text size
increases back to 44 for the main title and up one size also for the
second line to 28.
The text size
increases back to 44 for the main title and up one size also for the
second line to 28.
Format Table
Depending on exactly how you insert rows and columns, you may have some cell
borders that are formatted like the outside table borders. You can reset all
of the borders easily.
All those numbers would be easier to read if they were aligned to the right. It's
the way we expect numbers to be written.
- Click in the table and from the Table menu, select command.
Or click on the table's border.
- Click the arrow to the right of the Borders button
 on the Formatting bar to open the palette of border options.
-
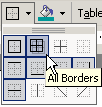 Select
 All Borders.
All of the cell borders are reset to the default color, style, and width.
-
Drag to select all of the temperature cells (numbers).
-
Click on
 the Align Right button on the Formatting Bar.
-
Save to your Class disk.
[nz-table.ppt]
How to handle a full Class disk
Evaluate
View the slide at
Full Screen.
 What do you think of a
table this big? Is it easy to read? Could you accomplish your purpose
with less data? How about separate slides for Celsius and Fahrenheit
temperatures? Would a chart be better?
What do you think of a
table this big? Is it easy to read? Could you accomplish your purpose
with less data? How about separate slides for Celsius and Fahrenheit
temperatures? Would a chart be better?
In the next lesson you will add a chart to a slide. Will it be easier?
Better?
~~ 1 Cor. 10:31 ...whatever you do, do it all for the
glory of God. ~~

 Creates a table with evenly sized rows and columns, centered on the
slide.
Creates a table with evenly sized rows and columns, centered on the
slide.
 Also creates a table with evenly sized rows and columns, centered on the
slide.
Also creates a table with evenly sized rows and columns, centered on the
slide.
 Allows you to draw a table
at the location and size that you want and then to draw in
different sizes of rows and columns.
Allows you to draw a table
at the location and size that you want and then to draw in
different sizes of rows and columns.
 Tables
and Borders Toolbar:
Tables
and Borders Toolbar: