
Jan's Working with Databases
Forms & Reports: Reports: Report Wizard
There are several ways to create a printable report of data from your tables and queries.
 Methods to Create a Report
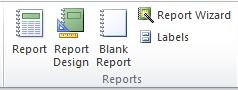
The Create ribbon tab has a tab group for Reports.
- Report button: Creates an autoreport with each record in one table row.
- Report Design: Opens a blank report in Design View. Manually add controls.
- Blank Report: Opens a blank report in Layout View. Manually add controls.
- Report Wizard: Dialog walks you through choices. Can use more than one table or query.
- Labels: Lets you choose an Avery label style and pick fields to use to create address labels.
You have already created an autoreport in Project 2: Access Basics. An autoreport can be based on only one table or query.
In this lesson you will use the Report Wizard, which walks you through some choices. You can include fields from more than one table or query. The report that the wizard produces is not all that great. Later you will create a report directly in Design View.
Report By Wizard
The Report Wizard takes you through the choices to create a report. It works best for simple reports.
How to start the Report Wizard:
- Ribbon: Report Wizard button

Steps in the Report Wizard:
![]() Click each step below to see the wizard's page at the right.
Click each step below to see the wizard's page at the right.
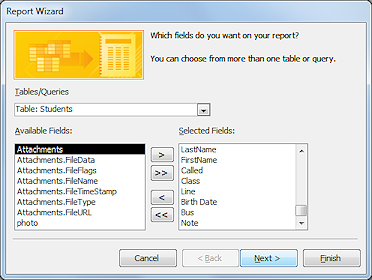
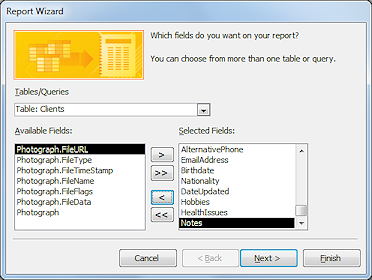
- Step 1: Source for the data - one or more tables or queries and which fields to include
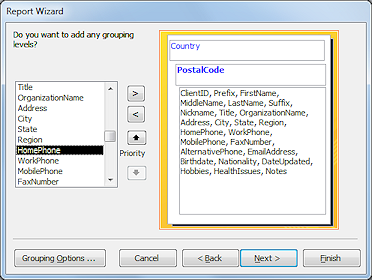
- Step 2: Group data on one or more fields.
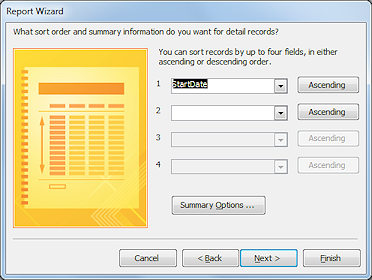
The Grouping Options button opens a dialog where you can choose an interval to group on, such as each month or on the first letter. - Step 3: Sort on up to 4 fields. The Summary Options button opens a dialog that offers to calculate Sum, Avg, Min, and Max for fields that are Number data type.
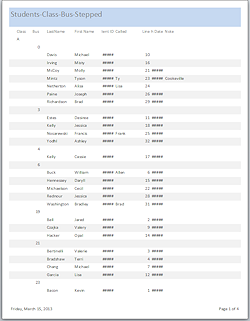
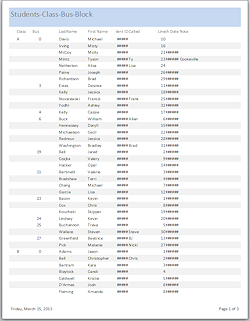
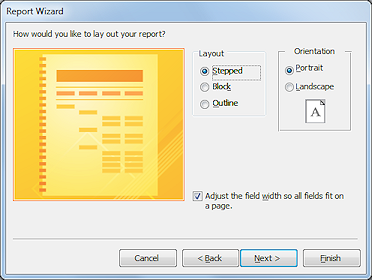
- Step 4: Layout, one of 3 layouts (shown below) . Choose Portrait or Landscape orientation for the paper.
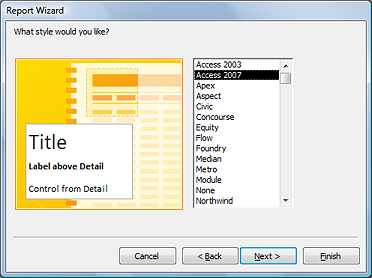
- Step 5:
 Access 2007: AutoFormat styles, one of the pre-installed styles plus any
previously saved custom AutoFormat styles (examples shown below)
Access 2007: AutoFormat styles, one of the pre-installed styles plus any
previously saved custom AutoFormat styles (examples shown below) - Step 6: Title for the
report, which will be the name of the report also
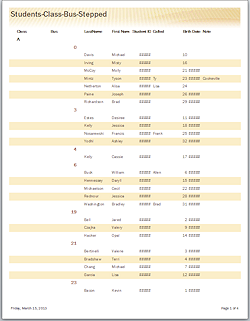
Report Wizard: Layouts
The Report Wizard offers 3 different layouts, plus the option to use Portrait or Landscape orientation. The differences are more obvious when there are several grouping levels. The examples below show 2 groups - Class and Bus number. The Stepped and Block reports were adjusted a bit in Design View to put the Class letter and Bus number closer together. The original layouts looked really awkward!
|
 |
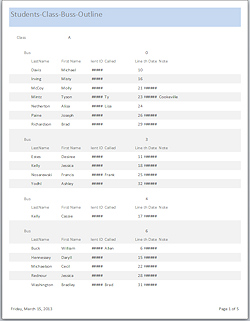 |
| Stepped | Block | Outline |
Access 2007: AutoFormat Styles
![]() Access 2007 comes with 25 pre-designed AutoFormats that you can choose in the Report Wizard dialog, or later, from the Report Design Tools: Arrange ribbon tab. (Be sure to select the whole report first!)
Access 2007 comes with 25 pre-designed AutoFormats that you can choose in the Report Wizard dialog, or later, from the Report Design Tools: Arrange ribbon tab. (Be sure to select the whole report first!)
![]()
![]()
![]() Access 2010, 2013, and 2016 have the same 25 AutoFormats but the command is not on any of the default ribbon tabs. You have to add the AutoFormat button to the Quick Access Toolbar or to a custom ribbon or tab group.
Access 2010, 2013, and 2016 have the same 25 AutoFormats but the command is not on any of the default ribbon tabs. You have to add the AutoFormat button to the Quick Access Toolbar or to a custom ribbon or tab group.
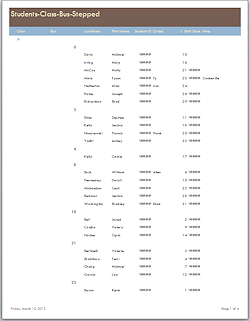
An AutoFormat style includes formatting for the Report header/footer, Page header/footer, Group header/footer, Detail section, controls and labels. The examples below show the same report with different AutoFormats. The layouts are the same. The formatting is different - background, fonts, font colors, font sizes.
Examples of AutoFormat applied to a report:
|
 |
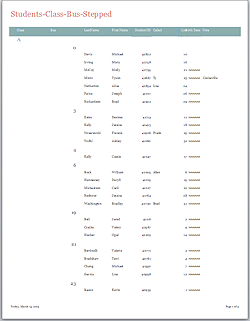 |
| Trek | Median | Civic |
| |
Step-by-Step: Report Wizard |
|
| What you will learn: | to use the Report Wizard to create a report |
Start with: ![]() , resource files, worldtravel-Lastname-Firstname.accdb from folder databases project4 as updated in the previous lesson
, resource files, worldtravel-Lastname-Firstname.accdb from folder databases project4 as updated in the previous lesson
- If necessary, open the World Travel database that you have been creating in this project.
- In the Create ribbon tab, click the button Report Wizard .
The Report Wizard opens.
-
 Step
1: Source
Step
1: Source
Select the table Clients as the source.
- Click the >> button to move all of its fields to the report.
-
Move the fields about Photograph back over to the left.
None of these records have an attached photograph. Additional tables/queries: At this point you could select other tables or queries from the list and add some
or all of their fields to the Selected Fields list. Not this time.
Additional tables/queries: At this point you could select other tables or queries from the list and add some
or all of their fields to the Selected Fields list. Not this time.
- Click on Next >.
-
 Step
2: Groups
Step
2: Groups
Scroll the list of fields and select the field Country as the first grouping level.
- Click the > button to change the sample document to
show the group heading.
- Select the field PostalCode and
click the > button.
Now you have two grouping levels.
Your records will be grouped by country and within each country, grouped by postal code.
- Click on Next >.
-
 Step
3: Sorting
Step
3: Sorting
Sort Ascending on LastName, FirstName, MiddleName, in that order.
- Click on Next >.
-
 Step
4: Layout
Step
4: Layout
Select the Stepped Layout and Portrait Orientation.
- Leave checked the box, "Adjust the field width so all fields
fit on a page."
- Click on Next >.
- Access 2007:
 Step
5: AutoFormat Style
Step
5: AutoFormat Style
Select the style Access 2007.
- Click on Next >.
-
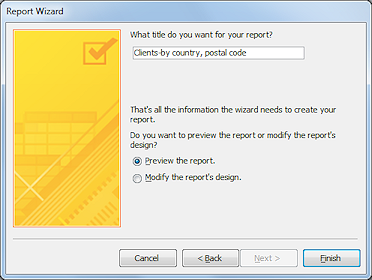 Last Step: Title
Type for the title of the report
Clients-by country, postal code
-
Click on Finish.
The report opens in Print Preview.
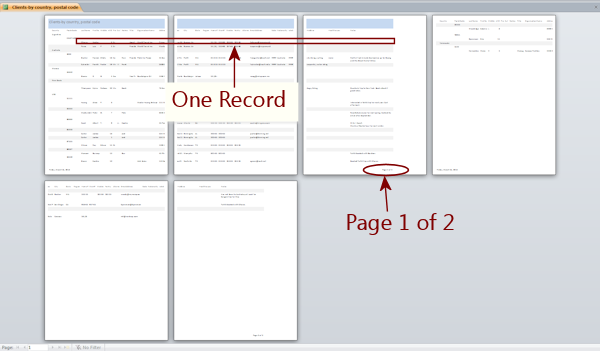
- Inspect the pages.
Something is wrong! It takes 3 pages to get all of the fields for one record, even though you checked the box "Adjust the field width so all fields fit on a page.". The third sheet of paper has a Page Footer that reads "Page 1 of 1" or "Page 1 of 2". What happened??
Perhaps Landscape view will be better. -
From the Print Preview ribbon tab, click on the Landscape button.
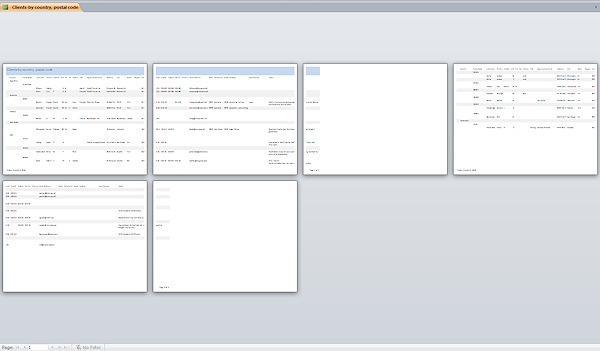
Not any better! Even in Landscape orientation, the paper is just not going to be wide enough to hold all of these fields in a single row.
Happily, we are not stuck with just one row! Report Design View lets you rearrange the controls much closer together!
 Evaluate: How usable is this report? Why did it get so spread out?
Not very usable! It's a bad idea to spread data from a single record over different pages if you can possibly get around it. The wizard stuck all of the controls in a single row. Not too smart, in this case.
Some fields are blank, but the report leaves the space for them anyway. Another source of empty space.
This report is not usable at all. Apparently the Report Wizard is not so good when there are many fields.
 Save your changes and close the report.
[Clients-by country, postalcode]
- In the Navigation Pane, rename the report as Clients-wizard.
The title control in the report does not change.
Report Wizard: With Photo
You left out the Photograph control in the first attempt. That's because it causes a lot of trouble! Let's try it with that control included to see how bad it can be.
- Start the Report Wizard again.
- Make the same choices as before except do include
the Photograph field in Step 1 and use a different title in Step 6.
- Step 1: Clients table. All fields including Photograph but not the details of Photograph, like Photograph.FileName and similar.
- Step 2: Group on Country and PostalCode fields.
- Step 3: Sort Ascending on LastName, FirstName, MiddleName.
- Step 4: Stepped layout and Portrait orientation
- Step 5: Access 2007: Access 2007 style
- Last: Title = Clients-photo
-
Inspect the print preview.
It takes 3 pages to see all the data for one record, and 18 pages total. Ouch!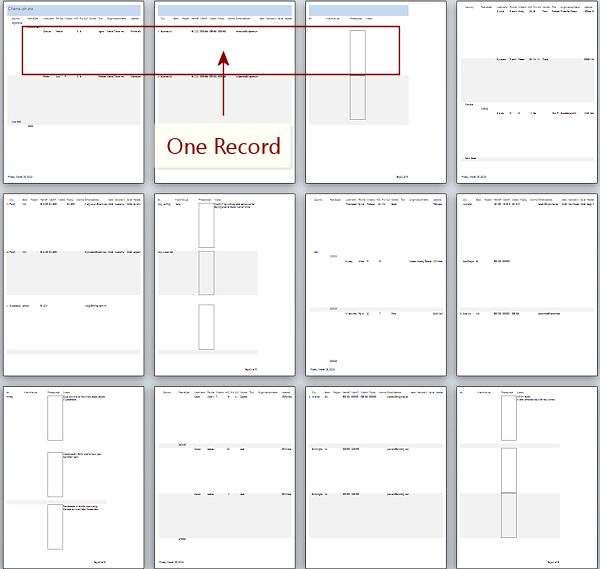
- Change to Landscape orientation.
Now it still takes 3 pages to get the controls for one record. It does look like the report could be made narrower to eliminate the third page. But is it worth keeping at all?Evaluate: How usable is this report? It's still really bad! Having that tall Photograph control wastes a LOT of space when the other controls are in a single row.
- Close the report without saving changes.
It's a good thing we have more lessons ahead so we can learn how to do this right!
|
|
| © 1997-2017 Jan Smith All Rights Reserved |
Site Map What's New |
Privacy Policy Terms of Service Copyright Acknowledgements |
~~ 1 Cor. 10:31 ...whatever you do, do it all for the glory of God. ~~
Last updated: March 22, 2017