Jan's Working with Databases
Tables & Queries: Exercise Access 3-1
You need to use what you just learned and what you learned in the previous project, and maybe learn a little more. The exercises with databases will require more steps than in the other lessons!
Complete all parts of the following exercises. Don't forget to backup your Class disk when you have completed the exercises or whenever you stop for the day and saved a document along the way.
Exercise Access 3-1: Game Scores
| What you will do: | Save and use a copy of a database Change properties of fields Create relationships Create and use an update query Create and use a parameter query Compact and repair database Create select and totals queries with criteria Create a calculated field in a query Print documentation - datasheets, documenter report, relationships, object dependencies |
Start with: ![]() Access open, gamescores.accdb from the resource files
Access open, gamescores.accdb from the resource files
People who play games like to keep score. Lots of scores! Some computer games track lots of things during the game but do not save all of that lovely information to compare with your next attempt. You can do that in your own Access database!
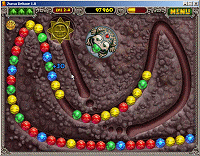 You will be working with a database that records scores for each of the
76 levels in a popular computer game, Zuma®, and some totals for
successfully completed games. The resource file gamescores.accdb provides you with actual scores
from actual games, played by me.
(Yes, it was a lot of 'work'. But it was all for YOU! ![]() I confess that
this was not the first time I played Zuma. It took a lot of practice to get good enough
to actually finish all of the levels!!)
I confess that
this was not the first time I played Zuma. It took a lot of practice to get good enough
to actually finish all of the levels!!)
If you have never played it, I have written a short explanation: How Zuma works
Disclaimer: I do not have an investment with or any
relationship with the creators of Zuma. I just enjoyed the game enough to
buy it!
![]() Warning:
Playing computer or console games for a long time can damage your wrists
and back. Take breaks. Gradually increase your playing time, just
like for any other physical skill. Too much practice can hurt! Tendonitis
is not fun!
Warning:
Playing computer or console games for a long time can damage your wrists
and back. Take breaks. Gradually increase your playing time, just
like for any other physical skill. Too much practice can hurt! Tendonitis
is not fun!
Save As: New Name
- From your resource files
 , open gamescores.accdb
  .
.
You will be making changes, so you need to work with a new copy of the database.
-
 Create a copy to work with, using the name ex3-1-gamescores-Lastname-Firstname.accdb , with your own first and last names, of course.
 Access 2007: Office button > Save As


 Access 2010, 2013, 2016: File tab > Save As > Save Database As
The new copy opens in Access, ready for your changes.
If you see a security warning, click the Enable Content button.

 Open each table in Datasheet view and in Design View.
Inspect the fields, field properties, and values.This database has 3 tables, Level Scores, Levels, and TotalScores with data already entered.
- View the relationships.
A relationship already exists between Level Scores and Levels.
Change Field Properties
Some of the field properties are not particularly well-chosen. You will change some of them. When data has already been entered, some changes are more dangerous than others!
TotalScores table:
About the table: This table holds the final score and statistics for completed games. The values in the Time field appear to be clock times, like 2:21:15 AM. They are actually elapsed times, like 2 hours, 21 minutes, 15 seconds. You have two choices - use one of the date/time formats or change to Text type and create your own format. The easy way is to use an existing format! That also allows you to do arithmetic with the times which you cannot do with text data. (Do you see something coming later in this exercise??)
 In Design View, change the Time field's Format property to Short Time.
 Save the table.
When you change field properties, Access may give you a general warning or two. It will proceed to do whatever you told it to do once you click OK. Access does not actually look at your data before giving the warning. You have to look yourself to see if any of those bad consequences will happen.
 Switch to datasheet view and inspect the results.
You've got hours and minutes but where are the seconds?? Two of the times now look like they are equal. Did you really lose those seconds?
- Click in a Time cell.
The value displayed changes! The Input Mask property applies while you are editing or entering new data. The seconds are there!Remember: What Access actually stores is not always what you see!! Times and dates are really just numbers. A time value is the decimal part of a date/time value, while the whole number part of the value is the number of days since the starting date, 12/30/1899. Times without a date attached have zero as the whole number part, like 0.058574.
Did you see?
In TotalScores, one game finished much faster than the others with a much lower score. What happened? I thought I had paused the game when the doorbell rang, but the game kept running while I was gone until all my lovely stack of lives was used up.
- Close the TotalScores table.
Levels table:
About the table: The field AceTime shows what time the game designers challenge you to beat.
You don't have to guess at how big the field sizes should be. You've got actual values to look at! You will now change those field sizes to reduce the size of the database. The larger the database, the more effect field sizes have on the total size of the database and therefore on the speed of actions like sorting and filtering.
 In the Levels table, open the datasheet view and look at some of the subdatasheets.
A subdatasheet shows all of the records in Level Scores for that particular level. Cool!
 In Design view, change the Field Size for LevelName to be just large enough to hold the longest level name.
How many characters is that?? Count the letters in the longest name.
(Be sure to widen the column enough for you to see the widest name!)
 Save the table.
You get a warning message.
 Be sure that the field
size is large enough! Access does not look first to see if a problem
actually exists, and then warn you. It just
gives a general warning and then does whatever you told it to do. If you
chose a size of 30 and an entry has 35 characters, the last 5 characters
are thrown out!
 -
Change the Field Size for the fields Stage and Level from Long Integer to Byte.
The size Byte will hold only whole numbers from 0 to 255. Long Integer numbers use 4 bytes. Since our numbers must be between 1 and 13, this will work out great!Another choice would have been to change these two fields to Text fields with a size of 2 characters. We are not going to do any arithmetic with the stage and level values!
 Save the table.
  Inspect the datasheet for unacceptable changes. Fix any problems.
- Close the Levels table.
Level Scores table:
About the table: In the Level Scores table, the field LevelID is a foreign key. It is the primary key for the table, Levels. It must be a Long Integer size in Level Scores, even though we know that the numbers only go up to 76 for this game, because the field is in an AutoNumber in the Levels table. That is the nature of keys.
There are some missing values for level scores. Somehow I simply failed to record those levels! I know it is hard to believe, but I cannot deny that those blanks are there. Data entry can be hard. It's not that it is hard to do. It's just hard to remember to do!
You might think that I could reconstruct a missing score by adding up the other levels and subtracting the sum from the TotalScore for the whole game. Sounds good, but... there are bonus points added at the end of a game, so the difference will not be just from the missing level score. <sigh>
We don't need to change any of the field properties but the table name needs a change. Also, to join this table to the TotalScores table, we need to add a field.
- Change the name of the table to LevelScores, with no space between.
It is easier to manage expressions when the object names do not have spaces.
 Open the Relationships window.
Whoops. The LevelScores table is missing! When you changed the name, Access dropped it from the Relationships diagram. The Relationships window does not have to show all of the available tables.
-
Drag the LevelScores table from the Navigation pane and drop it in the Relationships diagram.
The join you created before comes back. Whew! That's a relief. There was no warning about this effect. -
Resize the tables at the top of the Relationships window to show all of the field names.
-
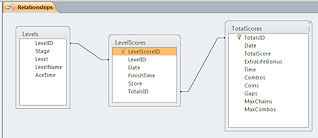
Inspect the Relationships: Do you see a field that you could use to join LevelScores and TotalScores?
There is not one! We need to add a field to LevelScores that tells us which TotalScores record the level belongs to.Good database practices would have created a blank TotalScores record before starting the new game. Then the correct TotalScore ID could be entered with a level score. After all, it is possible to play under different user names so that you have several unfinished games in progress at the same time.
 In Table Design View, add a new field to LevelScores named TotalsID.
This field should be a Long Integer type of Number field.
Description = Foreign key, from TotalScores table.
- Create a relationship between LevelScores and TotalScores using the field TotalsID.
(You may have to drag the bottom edge of the table in the Relationships window to see the field you just added.)
Rearrange the tables in the Relationships window so that the join lines are short and direct.
 Save the changes to the
Relationships window.
 View the datasheet for the table TotalScores.
- Open the subdatasheets which show the levels
that are part of this completed game.
None of the records actually have any records in the subdatasheet. The LevelScores table has the field but you have not put any data in yet! Problem: No subdatasheets
in the TotalScores table
Access needs to refresh its understanding of the table after you create a new relationship.
Solution: Close the table and open it again.
Create an Update Parameter Query
In the LevelScores table, the TotalsID column is blank. You will create a parameter update query to put values in that column. The value for the TotalsID field is the same for a whole set of levels, which is 76 records. That's because there are 76 levels whose scores are added up to make a Total. These levels were added to the LevelScores table all at once, so the LevelScoreID values are in sequence. The Level numbers start over again when the scores go with a new total. That makes it easy to create an update query to put in the TotalsID.
- Inspect the table LevelScores.
Find the beginning and ending ID numbers for the sequences.
The first set are from 1 through 76. But there is a set that only has 43 records instead of 76. - Create a new query based on the table LevelScores.
 Add to the grid the fields LevelScoreID and TotalID.
- Add to the Criteria row in the LevelScoreID field Between 1 and 76.
This will pick out the first whole game, levels 1 through 76.  View the datasheet and make sure that only one set of levels got selected- 76 records.
 Change the query to an Update query.
- In the Update row of the TotalID column, enter the value 1.
 Run the query.
 View the datasheet for the LevelScores table.
Only the first 76 records should now show a TotalsID value of 1. The remaining records are still blank. Change the query to a parameter query:
Criteria: Between [First Record] And [Last Record]
Update To: [Which TotalsID?] Run the query again.
The Update To parameter comes up first. Use 2.
For the criteria, use 77 and 152.
Inspect the datasheet to make sure it worked.
Repeat:
TotalScoresID = 3 for records 153 through 228
TotalScoresID = 4 for records 229 through 271 -(Not 76 records!)
TotalScoresID = 5 for records 272 through 347 Save the parameter query as QUpdate-TotalsID
Compact and Repair Database
Since you reduced some field sizes, it is likely that the database file is taking up more room on the disk than necessary.
- View the Database Properties, General tab and find the current file size and write it down.
- Use the Compact and Repair
Database tool.
Access will close the database, make a new copy with the same name, and reopen the database. All the wasted space should be gone.
- View the Database Properties, General tab again to see the new file size and write it down.
It should be noticeably smaller even though the file is small over all.
Queries
Now that your tables are neatly related to each other, you can create some queries to answer some questions!
Question: Are there missing scores or finish times?
 Create a new query that includes the tables LevelScores and Levels.
-
Drag the * from the table field list to the design grid for each table.
Drag the field FinishTime from the LevelScores table to the grid.When you use the * to include all fields and you want to use criteria, you must add the fields for criteria separately.
- Add criteria to find null values for FinishTime.
Uncheck the Show box for the FinishTime field.
 Run the query.
Which levels do not have a FinishTime value? (There are 3.)
 Change the query to find records that do not have a Score
value, Score is null.
 Run the query.
The datasheet shows only 1 record.-
 Inspect the datasheet for LevelScores.
There is one null cell and 2 with zeros. Access does not think of zero as the same as Null. A Null values means that no value has been entered. Zero means "0" was entered. An important difference!Some fields have a default value set to zero to avoid this issue.
 Save your query as QNullScores.
Question: What was the highest score for any level?
 Create a new query based on the table LevelScores.
You can use the Max function to find the largest score.
- Drag the * down to the grid and also drag the field Score separately.
- Click the Totals button.
Whoops. Access won't let you use the * to include all fields and use the Totals row for anything.
- Delete the * column, leaving only the Scores column, and click on Totals again.
The Totals row appears.
- Select the Max function.
 Run the query.
The datasheet has one value, MaxOfScore = 26620. That's the best score for any single level in the database.
 Save your query as QMaxOfScore.
Question: What are the highest scores for each level?
 Add the table Levels to the
query QMaxOfScore.
- Drag the fields Level and LevelName from the Levels table to the grid.
- Leave the Totals row value as Group By for the added fields.
-
 Run the query.
The datasheet shows the maximum value for each of the named levels but there are only 22 records instead of 76. What happened? The query grouped on LevelName. But the level names and the associated map repeat as you go through the game, but they become more difficult each time. A level appears in the game as many as 4 times or as few as once. So there are 22 different maps.Question: Can you tell quickly which of these "highest" values is the smallest?
An easy way exists so don't save yet!
Question: Which level has the smallest of the high scores?
 In the datasheet for the query QMaxOfScore, click the down arrow in the heading of the
MaxOfScore column and click on Sort Smallest to Largest. Which level has the smallest score?
 Save As: QMaxOfScore-EachLevel.
 If
you click the Save button on the Quick Access Toolbar, Access will overwrite the
original query!

 Switch to Design view and back to Datasheet view.
The sorting you applied with the button is gone. To have sorting automatically applied each time you run the query you can change the query just a little!
 In Design view, choose Sort Ascending for the column Score.
 Run the query.
With the values sorted, it is easy to see which is the lowest and which is the highest value.
 Save the query with the same name.
[QMaxOfScore-EachLevel]
Question: What is the fastest time for a level?
 Create a query based on LevelScores.
Include only the field FinishTime.
 Run the query.
 Sort the FinishTime column in
order, Oldest to Newest.
Remember that these values are actually elapsed time, but Access thinks that they are clock times so you cannot pick Smallest to Largest. We want the smallest elapsed time, which will look to Access like the earliest clock time = Oldest. A bit confusing!
The first three records in the sorted datasheet are blank. The shortest time that was recorded is 14 seconds. (0:14)
 Save the query as QFinishTimes-min.
 In Design view, show the Totals row by clicking the Totals
button.
-
Use the Min function to find the shortest time.
 Run the query.
 Whoops! The value shown is 12:14:00 AM! Where did THAT come from?
About Time values: (Working with dates and times is tricky!!)
Access records time values as the decimal part of a number where the whole number represents the date. It does its arithmetic with those decimal numbers and then re-interprets the result according to the format that you chose. Access thinks that your 0:14 is a Date/Time value for 14 minutes after midnight!
Access does not have special formats or functions for handling elapsed time! You could write a Visual Basic function to do this, but that is beyond the level of these lessons!! It's amazing how difficult some ordinary things can be to do on a computer.
 Save the query and close it.
[QFinishTimes-min]
Question: Which times are faster than the AceTime?
Ace Time is what the game designers set as a goal for you to beat.
 Create a new query based on the LevelScores and Levels tables.
Include the fields TotalsID, Stage, and Level, in that order.
- Sort all three fields ascending.
- Create a new field in the query named Faster, using a conditional expression to display the phrase "Faster!" if the FinishTime is faster than the AceTime and the phrase "Too long" otherwise.
Faster: IIf([FinishTime]<[AceTime],"Faster!","Too long")
 Run the query.
 Save the query as QFasterThanAceTime and close it.
Question: How many of the FinishTime values are slower than the AceTime for each level? For which levels is it the hardest to beat the AceTime?
 Create a new query based on the LevelScores and Levels tables.
Include the fields Stage, Level, and LevelName (in that order) and sort ascending all three fields.
- Add a calculated field to the query grid named TimeDiff, which subtracts AceTime from FinishTime.
TimeDiff: [FinishTime]-[AceTime]
A positive result means the level was finished slower than the AceTime.  Run the query.
You should see 347 records with both positive and negative TimeDiff values, all of which are decimals. Those messy decimals are ugly!
 In Design view, show the Totals row and set the TimeDiff column Total row to Count.
Leave the other three columns at Group By.
 Run the query.
The TimeDiff column now shows a count of the number of TimeDiff values for each Stage/Level combination. Not too helpful. It does show that some values are missing. Now you can add criteria to pick out the times that did not beat the AceTime.
 On the Criteria row in the TimeDiff column, type >0.
The TimeDiff value will be positive when the FinishTime is greater than the AceTime.
 Run the query.
There is no change! What happened??
The query cannot filter with the criteria and use the Count function on the same column. You need to repeat the column so Count can be in one and the criteria in the other.
 Delete the criteria from the column with the Count function.
- Create another column with the same definition for the field
as the TimeDiff column but you must use a different field name, Diff:[FinishTime]-[AceTime]
(Access gets cranky if you try to use two calculated columns with the same name!) - In the Total row for the new column choose Where instead of Count.
That's what you need for fields with criteria when working with totals! - Add to the Criteria row the expression >0 that you just removed from the original column.
 Run the query.
The results datasheet has 29 rows that show the count of the number of times Diff is greater than zero for a particular level. Those are when the FinishTime for that level was larger than the AceTime. Sort the TimeDiff column from Largest to Smallest.
For what levels was it hardest to beat Ace Time (had the most times that were larger than Ace Time)?
 Save the query as QSlowFinishTime-levels.
- Close the query.
Compact and Repair Database Again
Since you have added a number of objects (queries) to the database, it is likely that the database file is once again taking up more space than it really needs.
- View the current file size from Database Properties and write it down.
- Compact and repair the database.
- View the Database Properties again to see the new file size, and write it down.
Is it any smaller? The difference is not as noticeable. You did not add any records, just some queries.
Your Own Queries
Now, create your own queries to find the answers to the following questions:
Question: What is the average of the scores for all the levels?
Create QAvgOfScore,
which produces just 1 number.
Question: What is the average score for the level that has a name
containing "mix"?
Create QAvgOfScore-mix (Use the Like operator in the Criteria row. This is a very useful
operator when you can't quite remember the text value you are looking
for!)
What other questions can you ask and answer with this database?
Question: Write your own question and create a query that finds the answer. Save your query with a name like QMyQuestion-FirstnameLastname where you use your own name and add a phrase that makes it clear what the question was, like QMyQuestion-MaxExtraLifeBonus-JanSmith.
What's in the Database Now
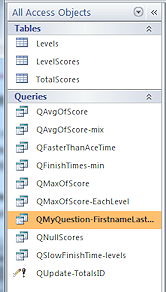
Documenting Your Database
There are LOTS of Documenter reports now available to you - one for each table and for each query. You can also print datasheets for each of those tables and queries. You can print the Relationships diagram. We won't do all of that! You do need to do a little printing, just to see what the limitations are.
Write your name and "Ex. 3-1" at the top left of each print-out
below.
(Unfortunately you cannot configure the page's header to include
such information automatically. Wait for Reports!)
Relationships

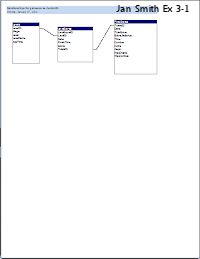 Open the Relationships window.
 Print the Relationships report from the Relationships window.
Datasheets
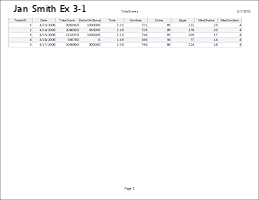
 Open the datasheet for the table TotalScores.
 Open Print Preview.
The table does not fit on 1 page with the default settings.- Make changes to the orientation, margins, or column widths until the table will fit on one sheet of paper.
 Print the datasheet for the table TotalScores.
-
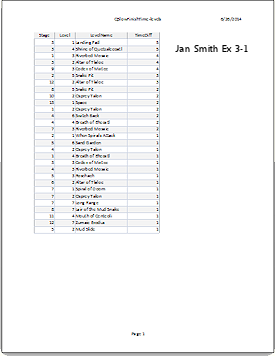
 Open the query QSlowFinishTime-levels.
  Print the datasheet for the query QSlowFinishTime-levels.
Make any changes needed for the datasheet to fit onto the page.
Documenter Reports
-
Open a Documenter report for the table LevelScores.
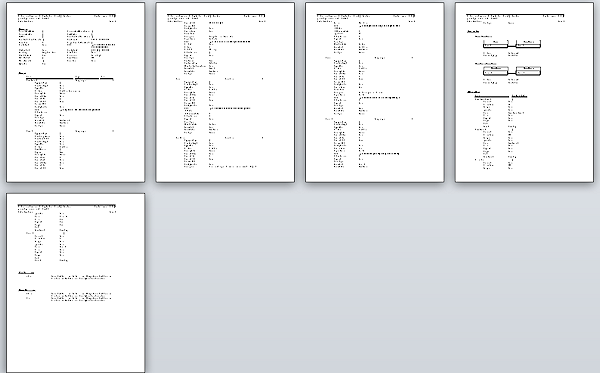
 Print all pages of the report.
Your name is part of the file name for the database.- Highlight or circle in the report the following information:
- Relationship type
- RowSource for LevelID field
- DistinctCount for LevelID (look at the indexes)
- Data type and Field Size for Score field
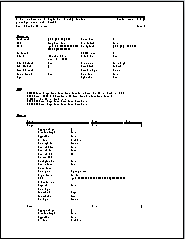 Open a Documenter report for the query QSlowFinishTime-levels.
 Print page 1 of the 3-page report.
- Highlight or circle in the report the following information:
- Page number
- SQL: Definition of the calculated field TimeDiff
- SQL: Criteria used
Object Dependencies
-
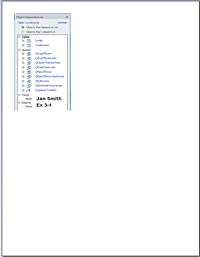 Select the
table LevelScores and open the Object
Dependencies task pane - Object that depend on me.
 - Capture a screen shot of the window and paste it into Microsoft Paint, or similar graphics program.
- Crop the image to show just the task pane.
- Add your name and Ex. 3-1 to the image.
-
 Print the screen shot.
 -
 Save in PNG format as ex3-1-dependencies-FirstnameLastname.png to the
folder databases project3 on your Class disk. Use your own first and last names!
Zuma® - ©2003-2006 PopCap Games, Inc. Zuma is a registered trademark of PopCap Games, Inc. All rights reserved.

This exercise uses a file from the databases resource files.
You cannot make changes to these files and save them in the same place. Save the changed documents to your Class disk. This keeps the original resource files intact in case you need to start over or another student will be using this same computer.
 How to handle a full disk