
Jan's Working with Databases
Tables & Queries: Exercise Access 3-2
You need to use what you just learned and what you learned in the previous project, and maybe learn a little more. The exercises with databases will require more steps than in the other lessons!
Complete all parts of the following exercises. Don't forget to backup your Class disk when you have completed the exercises or whenever you stop for the day and saved a document along the way.
Exercise Access 3-2: Language Arts Grades
| What you will do: | Rename the database Create relationships Create new tables Change field properties View subdatasheets Create a select query with criteria Create a parameter query Create calculated fields with text Use IIf Create an update query Create a Totals query with parameters Create a Crosstab query Use calculated fields with numbers Create a MakeTable query Create an Append query Delete a table Delete a relationship Repair a broken query Compact and repair the database Document the database |
Start with: Access open
This is a long exercise! You will use most of the skills you learned in the Tables and Queries project.
We have been using the Language Arts Classes database as an example when discussing new features. The original of this database was not formally "designed"; it just grew. So there are a number of things that could have been done better. (Yes, I say this even though I wrote it myself!) In this exercise you will use a start-up database based on the Language Arts Classes database. It has some tables with data. You will create some of the queries needed to calculate grades.
Some features of these tables are chosen to make it easier to work directly with the tables. That's not normally a good idea, but it can work well for the person who designed the tables! If we were going to work primarily with forms, we might choose differently.
Renaming Database
You need a copy of one of the databases in your resource files. This database contains some of the tables from the original Language Arts Classes database but none of the queries, forms, or reports.
If you do not have a local copy of the resource files:
- Download the file languagearts-tablesonly.accdb
 from the resource files and save it as
ex3-2-LanguageArts-Lastname-Firstname.accdb to your Class disk in the folder databases project3. - If you see a security warning, click the Enable Content button.
If you already have a local copy of the resource files:
- Navigate in a File Explorer/My Computer window to where you saved the resource files
to your hard disk.
- Select the file languagearts-tablesonly.accdb in a My Computer window and copy it.
- Navigate to your Class disk to the folder databases
project3 and Paste.
- Rename the file as ex3-2-LanguageArts-Lastname-Firstname.accdb using your own first and last names, of course.
- Double-click the new name to open the database in Access.
The database has a set of tables with no relationships yet and no other objects are included. - If you see a security warning, click the Enable Content button.
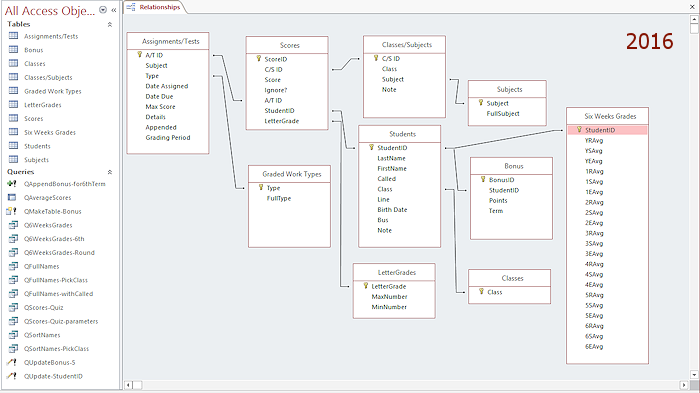
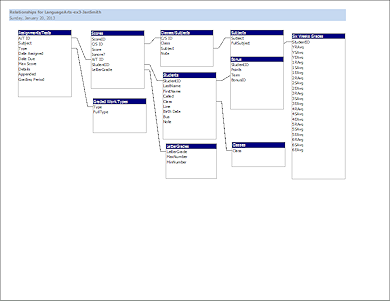
Design with Relationships in Mind
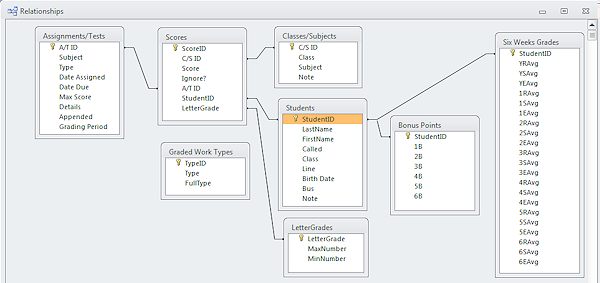
 Open the Relationships window.
- Add all of the
tables to the window. Drag the borders of the tables until all fields
and table names are showing. Drag tables by their title bars until they
are in approximately the arrangement in the illustration.
-
Create relationships between the following tables:
Students - Scores, matching StudentID fields
Students - Six Weeks Grades, matching StudentID fields.
Students - Bonus Points, matching StudentID fields
Scores - LetterGrades, matching LetterGrade fields
Scores - Assignments/Tests, matching A/T ID fields
Scores - Classes/Subjects, matching C/S ID fields
Try to create relationships but don't do it:
Assignments/Tests and Graded Work Types on the Type field.
Classes/Subjects and Students on the Class field.Look carefully at the Edit Relationship window for these two relationships. It shows that the relationship for both of these is "Indeterminate".
Whoops. That means that you can create a relationship BUT the values are not unique. Access cannot match them with any certainty. Not a good idea!
(If you already created these two relationships, delete them now.)You can fix these glitches, first by changing a table's design and then by creating some new tables.
-
 Save the layout by clicking the Save button on the Quick Access Toolbar.
Leave the Relationships window open.
Change Table Design
The field Type in the table Graded Work Types cannot be matched with the field Type in the table Assignments/Tests because the values are not required to be unique. You can fix that.
-
 Open the table Graded Work Types in datasheet view.
It lists the types of assignments that there are. This will be important to know when you calculate grades. Since the entries are unique, you do not actually need the TypeID field after all.
-
 Switch to Table Design View.
- Delete the TypeID field.
- Make the Type field the primary key.
Now the values are required to be unique, which they are already.
- Save the table and close it.
- Switch back to the Relationships window that you left open.
If the change you just made does not show, close the table Graded Work Types. If it still does not show, close the Relationships window and reopen it.
- Create a relationship
between the Graded Work Types and Assignments/Tests tables, matching
the Type field.
Now in the Create Relationship dialog it shows as One-to-Many. One problem solved.
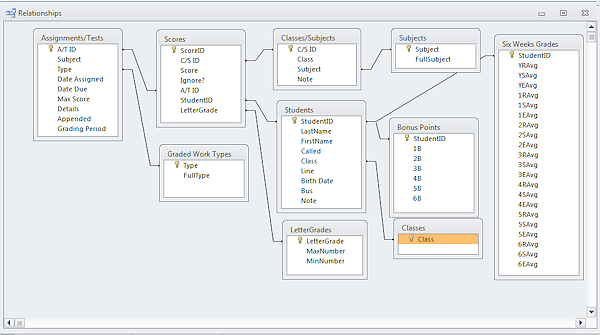
Create New Tables and Relationships
The combination of class and subject was useful but creates problems with relationships. You will create two new tables to help make things clearer to Access.
- Open the table Classes/Subjects in Table Datasheet View.
The datasheet shows the combinations of class (A, B, D) and subject (R for reading, S for spelling, and E for English). Each of the three classes studies each of the three subjects.
- Create a new table Classes with just one
text field, Class, with field size 1. Make it, of course, the
primary key. Enter the values A, B, and D as the three records in the
field. (I have no idea why there was not a class C!)
- Create a new table Subjects with just
two text fields, Subject and
FullSubject. Make Subject the primary
key with a Field Size of 1. FullSubject should have a Field Size of 10. Enter the values R and Reading, S and Spelling, E and English for the three records.
- Switch to the Relationships window and add the two new tables to the
display.
- Create relationships as follows:
Classes/Subjects - Subjects, matching the Subject field.
Students - Classes, matching the Class field
-
Save the layout and leave the Relationships window open until you finish the questions that follow.
 Exploring the Tables
and Relationships
Exploring the Tables
and Relationships
Find the answers to the following questions by viewing the relationships or the various tables in datasheet or design view. Record your answers as your instructor directs.
- Which relationships are One-to-Many? Which are One-to-One?
(Right click on a join line to open the Edit Relationships window)
- Predict, based on the relationships, which tables will have subdatasheets and what table that data will come from. Then look at the subdatasheets and see what actually shows.
- Which table has a subdatasheet which itself has a subdatasheet?
- Which tables have Lookup fields? What are those fields? How can
you tell it is a Lookup field?
- Which fields in which tables logically could be Lookup fields but aren't?
Edit Properties
After EACH change below, save the table. When you save, you might see a warning that some data may not fit the
new rules. Access hasn't looked yet! Let Access check the data.
(If you make several changes
and then find out that there is a problem, you won't know which change
caused the problem!)
If Access warns you that some data DOES violate the new validation rule or other settings, cancel the Save process and inspect the data. You will know that the problem was caused by your latest change to the table design. Make corrections to the data or table design, if necessary. For example, if a field is null that is now required to have a value, you should figure out what the appropriate value should be and enter it unless told otherwise in the directions. Then you will be able to make your change.
For this exercise you may need to temporarily delete a relationship in order to make some changes. But that can happen in other databases. In that case, you might need to close and reopen the Relationships or table design windows to make Access notice changes in relationships. Just be sure to re-create the relationship after you have corrected the problem.
Remember that text values must be enclosed with double quotes in a validation rule. Number values are NOT enclosed with quotes.
Set the table and field properties as described below.
Hint: Validation Rules must
be expressions, not sentences!
Table: Assignments/Tests
- Table Property:
Validation Rule - requires the date due to be either null or after the date assigned or on the same day - Table Property:
Validation Text = Date Due must be later than Date Assigned, on the same day, or Null. -
Subject:
Field Size = 1
Format: Formats as upper case
Validation Rule - requires the values R, S, or E
Validation Text = Choose R for Reading, S for Spelling, or E for English
When you save the table, you get a warning that data in Subject does not fit, but no hints as to which record(s) are the problem. Look at the datasheet. Assignment #65 does not have a value for Subject. Judging from the description, the assignment was in English.
Do not correct this record now. You will make a correction later.
-
Type:
Field Size = 1
Format: Formats as upper case.
Validation Rule -requires using one of the values D, Q, T, B, or W
Validation Text = Choose D for Daily grade, Q for Quiz, T for Test, B for book report, W for writing assignmentWhen you try to change the field size, Access refuses, saying that it is in a relationship. You must delete the relationship, change the field size, and recreate the relationship. You will probably have to close the Relationship and table windows to make Access realize that there is no longer a relationship.
Don't forget to recreate the relationship again.
- Date Assigned:
Input Mask = Short Date from the wizard
- Date Due:
Input Mask = Short Date from the wizard - Max Score:
Validation Rule requires a score less than or equal to 100.
Validation Text = MaxScore must be less than or equal to 100
Default Value = 100 - Grading Period:
Validation Rule - requires the value to be 1, 2, 3, 4, 5, or 6
Validation Text = Choose the grading period, 1, 2, 3, 4, 5, or 6
Required = Yes - Test the Validation Rules: In Table Design View click on the button Test Validation Rules.
The field Subject still has a problem. You will fix that later.
- Save and close the table.
Table: Scores
- Score:
Validation Rule - requires a value less than or equal to 110 (100 plus any bonus points) or else be NULL.
Validation Text should explain this rule. - Ignore?
Validation Rule - should require the value to be a slash (/) or to be NULL.
Validation Text - should explain that a slash means to ignore the value when averaging grades. (This field could have been a Yes/No field.) - LetterGrade:
FieldSize = 1
Validation Rule - should require a value of A, B, C, D, or F or else be NULL.
Validation Text - should explain this rule.
(The values in this field are created by an series of update queries.) - Test the validation rules, fix any errors, recreate any deleted relationships.
- Save and close the table.
Table: Students
- Class:
Format property should force upper case.
Lookup- Display Control is a List Box. The Row Source is the table Classes. Bound Column is 1. - BirthDate:
Input Mask uses Short Date, from wizard. - Test the validation rules, fix any errors, recreate any deleted relationships.
- Save and close the table.
Create Queries
Now that the tables are organized, you can start to work on queries that answer questions about the students and their grades, especially that most important question- "What's my grade?" That question is actually several questions since each student has scores for quizzes, daily assignments, and tests in three subjects. There are also averages for each of the six weeks grading period and for the year. Whew!
![]() Do
not use the Save button on the Quick Access Toolbar to save a changed query. That will overwrite the original. Use Save Object As.
Do
not use the Save button on the Quick Access Toolbar to save a changed query. That will overwrite the original. Use Save Object As.
- Select query: Create a Select query based on the Students table. Include the fields StudentID, LastName, FirstName,
Class. Sort alphabetically on LastName and then FirstName.
Save the query as QSortNames
View Datasheet: all students in alphabetical order,
with last name first.
- Parameter query: Change the query QSortNames to a
parameter query which allows you to select a Class. Include in your
parameter entry the choices for values for a Class: A, B, or D.
Save the query as QSortNames-PickClass.
View Datasheet: records for only one class.
- Calculated text field: Add a calculated field called FullName
to the query QSortNames-PickClass. The field combines fields to produce values like McCoy,
Molly. Show only the StudentID, Class,
and FullName fields in the datasheet.
Save the revised query as QFullNames-PickClass.
View Datasheet: records in alphabetical order for only one
class; showing the ID number, class, and full name of the student (last name first, comma, first name).
- Remove the parameter from the query. Change the query to sort by Class and then by full name.
Save the query as QFullNames.
View Datasheet: records for all students are grouped by class and alphabetically sorted by full name
within each class.
- Conditional Expression: The Called field
contains what the student
wants to be called by if not by their official first name. Change the
calculated field FullName to use the IIf
function. You want to use the value in the Called field if there is one instead of the value in FirstName. Otherwise you will use FirstName to calculate the FullName.
Save the query as QFullNames-withCalled.
View Datasheet: Only a few FullName values have changed. You should see records for Buck,
Allen and Greenfield, BJ, for example, instead of Buck, William and Greenfield, Beatrice.
Figuring Up Grades
A 6-weeks grade is a weighted average of the average daily, quiz, and test grades for that subject. The daily grade may have bonus points added. So we have several calculations to do!
Queries with Criteria
You will start with a fairly simple query and then add columns or other features as we go along. You will need a crosstab query to actually average the grades.
- Create a new query based on the Scores and Classes/Subjects tables. Include the fields A/T ID, Score, and Ignore? from Scores. Include the fields Class and Subject from Classes/Subjects.
- Sort ascending the columns Class, Subject, and A/T ID,
in that order.
- Criteria: In the Ignore? column, write in
the Criteria row an expression that matches null or empty cells.
(There are only 144 scores with a slash in the Ignore? field which cannot be included in averages.)
 Run the query.
You should see 7301 records grouped by class and subject, with
A/T ID in numerical order. The Ignore? column should be
blank for all these records. This is important!
- Add the table Assignments/Tests to the query and, if necessary, join it to Scores using the field A/T ID.
Include the fields Type and GradingPeriod on the grid.
In the Criteria row for the Type column, type Q, which stands for quiz. Do NOT let Access Autofill something else here. There are several functions with start with a Q.
- Run the query.
You should see 1561 scores for quizzes in English and Reading. There are
no quizzes for Spelling.
- Add the query QFullName-withCalled to the query. Join the StudentID field in the query with
the one in the Scores table. Include the
field FullName on the grid.
-
Run the query.
You should see a student's name in each row. There are 1552 records. We
lost 9 scores. Why?? Let's investigate.The joins between tables are of the type that include records only when there are matching records. In other words, if one table has a record that has no matching records in the other table, it won't show in the query results. So, a student with no score for a particular assignment won't be listed for that assignment. Neither will scores that don't match a student. (Having a score without a student is a bad data entry error!)
 Problem:
You had 143,612 records in the query results instead of 1552.
Problem:
You had 143,612 records in the query results instead of 1552.
You did not create the join between the query and the Scores table. Access showed the cross-product of the query and the other results (all possible combinations!). This query takes noticeably longer to run.
- In the Query Design window, change the join between Scores and the query QFullNames-withCalled to the third type,
"Include all records from Scores and only those records from
QFullNames-withCalled where the joined fields are equal".
- Run the query and then sort the datasheet ascending on the FullName column.
At the top of the sorted column are 9 rows with only a comma in the FullName
column. Strange! There are some scores that don't match with a student.
Not good!
- Add the field StudentID from the Scores table to the query and change to sort ascending only on the FullName field.
- Save this query as QScores-Quiz.
-
Run the query again.
Ah ha! Those blank records have a StudentID of 1, which is not a normal ID number. If you check the Students table, you will find that there is no student with that ID number.This glitch in data entering was my fault. A new student started class before I got her records, including her official ID number. I used 1 for her ID as a temporary number and changed the ID number later. I did not change her records in the Scores table to include her actual ID number. Big whoops! Those scores would not be counted when averaging her grades. (In real life I caught this error and calculated her grades correctly, of course!)
Problem:
StudentID does not show 1
You have used the StudentID field from the query QFullNames-withCalled instead of from the table Scores. That query uses the StudentID field from the Students table. The value "1" appears only in the Scores table, not in the Students table
Solution: In the query's design grid, in the Table row for the StudentID column, change the table to Scores.
- In the query datasheet, change the value 1 for StudentID to 40102.
Once you enter the number and leave the field, the student's name appears in the FullName column. Keyboard
shortcut to copy a value from the cell above in datasheet: CTRL + '
Keyboard
shortcut to copy a value from the cell above in datasheet: CTRL + '
You can type in the value in the record at the top of the datasheet, use the arrow key or Enter to move to the cell below. Hold CTRL and press the apostrophe key. The value above is copied.Problem:
Don't see a name in the FullName field after changing ID number
Make sure you put the correct number in and that you have exited the cell.
- Close the query.
We are finally done with this query!
Update Query
Let's stop a minute and handle the problem of that student whose StudentID number was 1. You already changed the StudentID for the quiz scores but there may be other types of assignments and tests that also need an updated StudentID.
If we are sure that all scores with 1 for the StudentID belong to the same student, we can use an update query to fix the records.
- Create a new Select query based on the Scores table.
Include the StudentID field and the ScoreID field.
- Type 1 in the Criteria row
for the StudentID column.
- View the datasheet for the query.
You should see a datasheet of 33 records with this ID number. So updating is needed.
- Change the query to an Update query.
Notice that the Update Query button on the ribbon tab is highlighted. This is one way to quickly tell what kind of query you are looking at. Another way is to check the icon in the Navigation Pane for the query.
- In the Update to: row, enter the value 40102.
- Run the Update query.
(Remember that viewing the datasheet does not actually perform the update.)
The message box says you will update 33 rows. Hurrah! That was not too painful.
Remember that the updated table does not automatically open for you to verify changes.
- Save as QUpdate-StudentID and close the query.
This query is not one that you would normally bother to save. It is a one-time use type of query. You are saving it here for the benefit of your instructor (and your grade) if you are doing this lesson as part of a course.
Comment on database design: I did not think ahead! If the join between the tables Students and Scores allowed cascading updates, we would not have had this problem to start with. When I changed the student's ID number in the Students table, Access would have automatically updated all of the records in Scores and any other other table that had a join to Students that allowed cascading updates.
Totals Query with Parameters
Now you can calculate the average of the quiz scores.
- Open the query QScores-Quiz in Design View and show the Total row.
Keep the sorting and criteria.
- Save the query as QScores-Quiz-parameters.
-
Set the values in the Total rows as follows:
Score - Avg
Ignore? - Where
The other columns can keep the default value of Group By.
Delete the column A/T ID.
Rearrange columns if necessary, to sort Ascending in the order Class, Subject, Grading Period, FullName. (They do not have to be side-by-side, just in that order from left to right.)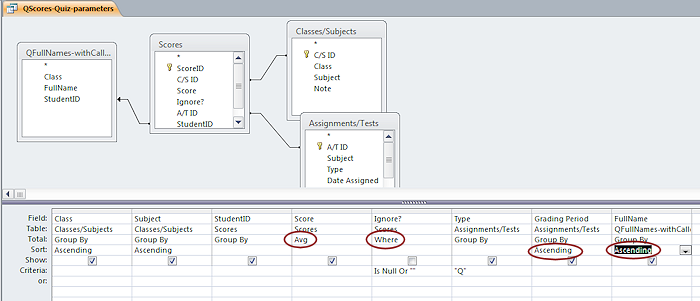
QScores-Quiz-parameters after adding Totals row
- Run the query.
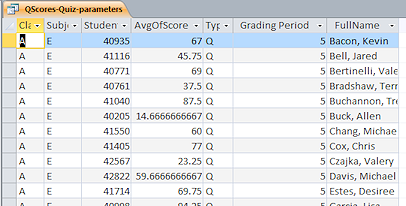 The results datasheet shows 366 records. These are ordered by Class and Subject
and Grading Period and then FullName. So the first 128 records are for
students in class A. The AvgOfScore column shows the average of the quiz scores for each student for each subject (Reading and English) for
each of the two grading periods.
The results datasheet shows 366 records. These are ordered by Class and Subject
and Grading Period and then FullName. So the first 128 records are for
students in class A. The AvgOfScore column shows the average of the quiz scores for each student for each subject (Reading and English) for
each of the two grading periods.
-
Add parameters to Subject and GradingPeriod columns:
[Which subject - R or E?]
[Which grading period - 5 or 6?]
(The tables only have records for the last two 6-weeks grading periods.)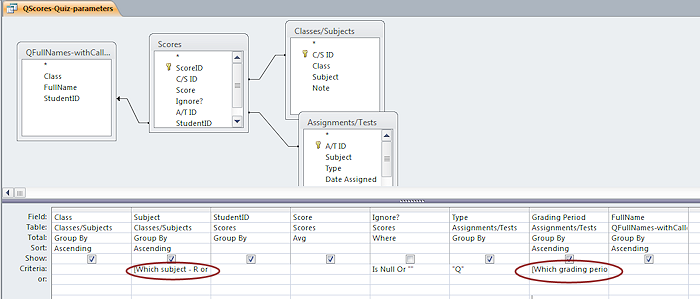
- Run the query. Make choices as you like.
The datasheet now has scores only for one subject in one grading period. There are 91 records for the 5th grading period and 92
for the 6th.
- Save the query and close it.
[QScores-Quiz-parameters]
Clearly you can manipulate the data in many ways with queries. You can add criteria and parameters to restrict the results. You can do sums and averages and counts using the Total row. You could also add formatting to make all of the averages have the same number of decimal places. We won't do that here.
Averages Query
The first step toward averaging grades is to get individual averages for each subject and grade type for each student. The query above did that just for quizzes.
Each student should have an average for 8 different SubjectType values, RD, RQ, RT, SD, ST, ED, EQ, ET for the grading period.
- Create a new query based on the tables Students, Scores, Assignments/Tests and the query QFullNames-withCalled.
- Include the fields:
Class and StudentID from the Students table
FullName from the query QFullNames-withCalled
Score from Scores
Grading Period from Assignments/Tests
- Show the Totals row and set the Scores column to Avg and the Grading Period column to Where. Add Grading Period to another column with the Totals row showing Group On and the check box Show checked. (You cannot show a Where column in the results.)
- Create a new field in the query SubjectType:[Subject]&[Type]
This will identify each of the averages, like RD for average of the daily scores for Reading.
- Run the query with criteria in the Grading Period column = 5 (for the
5th grading period) and then again with 6. The results should be
different.
Results: Each of 8 different SubjectType values, RD, RQ, RT, SD, ST, ED, EQ, ET, shows with a list of students and their average for the grading period for that subject and type of score, like English Daily grades, English Quizzes, and English Tests.
- Save the query as QAverageScores but leave its datasheet for the 6th grading period open.
We are not finished with this one yet. There is a problem to fix. Did you notice it in the datasheet?
Repair Data Entry Problem
You found a data problem earlier but were not allowed to fix it. Now it is time!
- Sort A - Z for the SubjectType column in the datasheet for
the 6th grading period of the query QAverageScores.
There are 92 rows with a SubjectType of just D. What happened??Data entry error strikes again! This time I did not enter a subject for the assignment and there was no validation rule to catch the error. How to fix this? First you must find which assignment record is the bad one!
- Leave the query open in Datasheet View.
- Open the Assignments/Tests table and sort the Subject column.
Aha! A/T ID 65 is the problem record. It's Subject field is blank. You found this problem when checking the validation rules earlier but I was not ready for you to fix the record. From the Details field it is clear that this was an English assignment.
- Type an E in the Subject field and
exit the field.
- Save the table and close it.
-
Inspect the query datasheet that you left open.
The datasheet may have updated automatically. No more plain D in the SubjectType column.
Note: You may have seen the screen flicker after you typed in the E and exited the field. Access was updating the related Score records.Note: If you typed a lower case e in the table, the Format property for that field turned it into an upper case E. BUT, the query shows what you typed! Surprised? I was! Go back to the table and enter an upper case E.
Problem:
Datasheet did not change
No changes? Not to worry!
Solution: Press the F5 key to refresh the display.
Alternate method: Switch to Design View and run the query again.
Results: All rows have the correct SubjectType combo. Hurrah!
Crosstab Query
Crosstab queries are just what you need to calculate the averages wholesale instead of one type at a time or one subject at a time. It will take two queries to get what we really want. The first one is a crosstab query that calculates the daily, quiz, and test averages for each student for each subject. The second query will take those values and calculate the 6-weeks grade using formulas that give different weights to the parts.
- Back in Query Design View, change the query QAverageScores to a Crosstab query.
The query keeps the Criteria in the Grading Period column. Crosstab queries will not accept parameters, which is one reason I did not ask you to use a parameter here earlier.
- If necessary, change the Criteria for Grading Period to the number 6 and delete the column with Where in the Totals row.
This will pick out the scores for the 6th grading period. - Sort Ascending on Class and FullName .
- In the Crosstab row, select the following:
StudentID, Class, and FullName - Row Heading
Score - Value
SubjectType - Column Heading
- In the Total row, set Score to Avg and leave the rest as Group By.
-
Run the query.
Results: Each row is for one student and shows the averages for
each type and subject for the 6th grading period. Cool!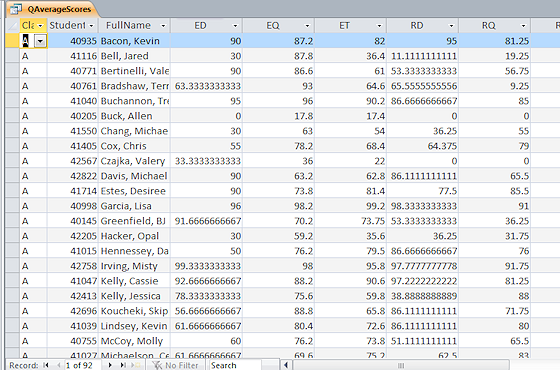
What are those ####?
Hash marks ####### show in a cell when the column is not wide enough to show the value. You can drag the right edge of the column heading to the right or double click it to make the column wide enough to show the widest item in the column that is showing.
- Save and close the query. (QAverageScores)
Perhaps it is just me, but I really don't like seeing all of those
decimal places. It's not worth fixing here. We can wait until we get the
6-weeks grade, which is what goes on the report card, and then format the numbers.
Calculated Fields for 6-Weeks Grades
The query you just created provides the numbers you need to do the 6-weeks grades. At last! You will create formulas to use those values in a new query.
Where does the 6-Weeks grade come from?
20% average of Daily scores, plus bonus points
30% average of Quiz scores
50% average of Tests
For Spelling there are no quizzes. The Daily and Test averages are each 50%.
Bonus points are recorded in a separate table. There is one value for each student for each of the 6-week terms.
Weighted formulas: You will need to replace the words below with the appropriate field name, operators, and grouping symbols. The parentheses are very, very, VERY important.
Reading or English average:
((2*(daily average+bonus points))+(3*quiz average)+(5*test average))/10Spelling average:
(daily average + test average)/2
- Create a new query using the tables Students and Bonus Points and the query QAverageScores.
- Include the following fields:
Class and StudentID from the Students table
All fields from the crosstab query QAverageScores, dragging the * from the table to the grid or double-click the * entry in the list. - Create the following calculated fields in the query, where
B is for the bonus points:
RAvg: (2*([RD]+[B])+3*[RQ]+5*[RT])/10
SAvg: ([SD]+[ST])/2
EAvg: (2*([ED]+[B])+3*[EQ]+5*[ET])/10
B:6B which will use the bonus points for the 6th 6-weeks in the formulas above
-
Run the query.
Results: A row for each student shows the averages for each
subject-type (RD, RQ, RT, SD, ST, ED, EQ, ET), and for each
subject (RAvg, SAvg, EAvg) for the 6th 6-weeks term. Why just
the 6th term? Because the crosstab query QAverageScores won't let us use parameters. To reduce the clutter, you need to change which columns show.
- Uncheck the Show box for the * column for the crosstab
query.
- Drag the FullName field to the grid.
- Sort ascending the Class and FullName.
Be sure that they have the Show box checked.
 Run the query again.
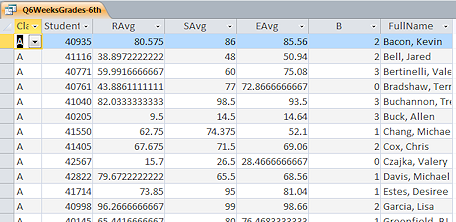
Results: Only 7 columns now - Class,
StudentID, RAvg, SAvg, EAvg, B, FullName.
- Save the query as Q6WeeksGrades-6th.
To change this query to do grades for a different grading period, you must
make two changes. The B field must be redefined for the grading period, like 5B for the 5th period, and the
criterion in the query QAverageScores must be changed to the grading period. Not a good plan.
MakeTable Query
Those bonus points in field B are a little bit of a problem. The points vary with each 6-weeks term. Because you set the criteria for the field B to 6B, the query can only do the calculation for the 6th 6-weeks.
The Bonus Points table has a separate column for each 6-weeks term for each student. Bad design! Better design would have each record include a student's ID, the number of the term, and the number of bonus points. You can move the data into such a table, with some careful planning. Action queries to the rescue!
First you will make a table with the records for the 5th grading period. Later you will append the records for the 6th grading period. Fixing bad table design is aggravating at best and requires careful planning.
- Create a new query based on the Bonus Points table.
- Drag the fields StudentID and 5B to the grid.
- Change the query to a MakeTable query.
A dialog appears asking for a name for the new table.
- Type Bonus as the new table's
name.
- Edit the column 5B to read Points:5B,
giving the field a new name in the table you are about to create.
- Run the query.
A message tells you that you are about to paste 92 records into a new table. Just right!
- Click Yes.
- Save the query as QMakeTable-Bonus and close it.
(Normally you would probably not want to keep this kind of query)
- Open the new table Bonus from the Navigation Pane.
It has two columns. So far, so good.
That StudentID of 1 is in this table, too. We will fix that later.
- Switch to Table Design view and make the following changes:
- Make StudentID the primary key.
- Add a new field named Term which is a
number field with size Byte.
Delete the default value of zero for this field. - Make the Points field also have a field size of Byte.
- Save the table and view the datasheet.
You will get a warning about reducing field size. It's OK!
The new table looks good except that nothing is filled in for the Term. An update query will take care of that!
-
Close the table.
Note: If you run the Make-Table query again and use the same name, you will lose the changes to the table's design.
Update Query
You created a new field for the Bonus table which has records from the 5th term but the Term field is blank for all records. These records should show a Term value of 5. An update query can do that lickety-split (meaning very fast)!
- Create a new query based on the Bonus table.
- Drag the field Term to the grid.
(Include only the field that you need to update. No criteria are needed for this query.)
- Change the query to an Update query.
- In the Update row, type 5.
All records will be updated to this value.
- Run the query.
You will get a message that you are about to update 92 rows. Exactly right!
(If you did not close the Bonus table, you will not be allowed to run the query.)
- Click Yes.
-
Save the query as QUpdateBonus-5 and close it.
(Normally you would not want to keep this query but your instructor will need to see that you have done what you were supposed to have done.)
- Open the Bonus table in datasheet view.
All the rows now show 5 for the term. Hurrah! -
Close the table.
Append Query
You need to get the bonus points for the 6th 6-weeks added to the new table Bonus. An Append query is what you need this time.
-
Create a new query based on the Bonus Points table.
-
Drag the fields StudentID and 6B to the grid.
-
Change the query to an Append query.
-
In the dialog that appears, select the table Bonus as the one to which you want to append records.
-
Click on OK.
-
In the Append to: row that appears, select for the column 6B the field Points.
-
Run the query.
Whoops. You get an error message. -
Choose No.
You don't want to append the records just yet. There is a primary key violation. Double-whoops.When we designed the Bonus table, we set StudentID as the primary key. But now you are appending another set of points for each student. Primary keys must be unique! You must revise the table design.
- Open the Bonus table in Design view.
-
Add a new field BonusID and make it an AutoNumber field and the primary key.
-
Save and close the table.
-
Run the append query again.
This time you get the message that you are about to append 92 records. Yes!
-
Save the query are QAppendBonus-for6thTerm.
Close the query.
-
Open the table Bonus and scroll through the records.
The values for Term for the rows you just added are all blank. You have another step to do.
Leave the table open this time. Point of Confusion: Updates will work even if the table is open. But, append queries won't work when the table is open.
 -
Open the query QUpdateBonus-5 in Design View.
(Be careful to open action queries in Design View unless you really mean to perform the action now!)
-
In the Update to: row, type 6.
-
In the Criteria row, type is null.
-
View the datasheet before you run the query!
You should see 92 rows only, all with Term field blank. -
Run the update query.
-
Close the query without saving changes.
- Open the table Bonus in datasheet view and inspect the records.
The Term column now shows either a 5 or a 6.
-
Correct Data Error: That StudentID of 1 is still hanging around! Fortunately that student earned no bonus points. Change the 1 to 40102 in the two records in the table now.
- Close the table.
Deleting a Table
You don't need the table Bonus Points anymore. All its data is now in the Bonus table. But, before deleting an object in Access, you should be sure that you won't be breaking something else! A query, form, or report might use your object. Access shows such dependencies in a task pane. For earlier versions of Access you had to have a good memory or do some inspecting.
-
Select the table Bonus Points in the Navigation Pane.
-
From the Database Tools ribbon tab, click on Object Dependencies .
Note: You may see a message about updating dependency information. Choose OK. It won't really take very long in this case.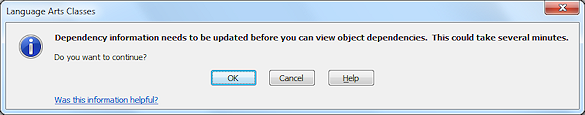
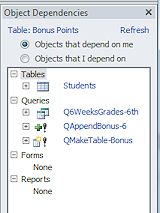 The task pane opens and shows a tree of
dependencies. What depends on this table?
The task pane opens and shows a tree of
dependencies. What depends on this table?
Table Students, Q6WeeksGrades-6th, QAppendBonusofr6thTerm, and QMakeTable-Bonus.
Thinking: What problems will it cause to delete the table Bonus Points?
- The table Students has a relationship with Bonus Points. You must delete the relationship before you can delete the table. That is not really a problem. (Access will make this easy!)
- The query, Q6WeeksGrades-6th will have to change to use the table Bonus instead of Bonus Points. This query is used to calculate the 6 weeks grades. This is the only real problem.
- The other
two queries were used to create and populate the Bonus table to start with and are not
really useful now. You would normally delete them anyway.
-
Delete the table Bonus Points.
A message box opens. Access won't let you delete without warnings! There is a relationship between this table and another. You must delete the relationship first.
-
Click on OK .
A second message box appears and offers to remove the relationship for you. (You have to read it carefully to see what it actually says!)
-
Click on OK in the second message box, too.
The table is deleted.
-
Open the Relationships window.
-
Add the table Bonus to the Relationships window.
-
If necessary, create a join between Students and Bonus using the StudentID field.
-
Close the Relationships window and save the changes to the layout.
Repair a Broken Query
Now that you have straightened out the bonus points and have deleted the Bonus Points table, you must fix the query that used that table. It should use fields from the Bonus table instead. You must make sure that the expressions to calculate grades can find the bonus point values. This is where it gets tricky if you do not pay very close attention!
- Open the query Q6WeeksGrades-6th in Design View.
You get a message that Access cannot represent the join expression. This is because one of the tables in the join just got deleted! This is an appropriate message for a known problem. -
Click on OK.
 The query opens in SQL view instead of Design View.
Not a pleasant sight! Unlike earlier versions, Access 2007, 2010, 2013, and 2016 will not open the Design View when there are such substantial errors. You can, however, edit the expression... very carefully.Problem:
The query failed to open.
If you try to run this query by double-clicking it or using the Open button, you get an error message. The query won't run at all since the Bonus Points table does not exist anymore. -
Edit the SQL expression: to change [Bonus Points].[6B] AS B to [Bonus].[Points] AS B
(The 'B' is used in the formulas to calculate averages for the bonus points. It makes the formula a bit easier to read in Design View.)If the text is too small for you to read easily, copy the whole expression and paste into a text editor. You can enlarge the font and do all of the editing. Then copy the edited version. Switch back to Access and select the SQL expression. Paste. Be very, very sure that you get ALL of the expression each time you copy!!!
- Edit all other instances of "Bonus Points" to just "Bonus".
- Switch to Design View.
Ah. Better to be able to see columns in the table! - Add the Term field from the table Bonus to the grid.
- Sort the Term field ascending.
- Arrange the columns so that Class, FullName, and Term
are in this order.
They don't have to be side-by-side.
This should group the records by class and alphabetize the students within the class. Each student will have two grades, one for the 5th grading term and one for the 6th.
- Note the column that reads B:Points.
That came from the edit you made to the SQL and makes the Points values be used where B is in the formulas.
- Save As Q6WeeksGrades.
This leaves the original query broken!
-
Run the query.
Results: Sorted by Class, FullName, and Term. So each student has a row for term 5
and one for term 6.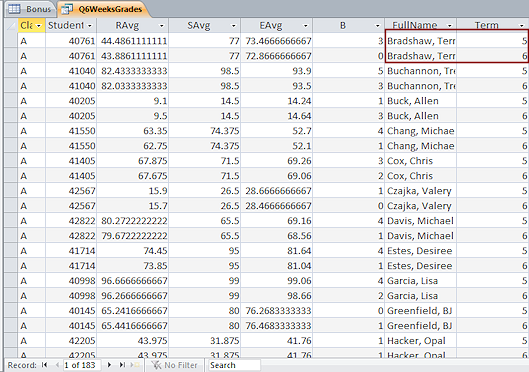
Yes, there are some really bad grades in this table!
Round Function
Now you can attack those ugly decimals. The Round function helps you manage the number of decimal places showing. The values are rounded, not just cut off.
General form:
Round(expression, number of decimal places to show)
If no number is entered, the Round function will produce
only integers.
Examples:
Round([Average],2) would display 19.23649 as 19.24, rounding
up to show 2 decimal places.
Round ([Price]*1.0925) would display 19.23649 as 19,
rounding down to show 0 decimal places.
- Edit the formulas in Q6WeeksGrades for RAvg, SAvg, and EAvg to use the Round
function and show 1 decimal place to the right of the decimal point.
RAvg: Round((2*([RD]+[B])+3*[RQ]+5*[RT])/10,1)
SAvg: Round(([SD]+[ST])/2,1)
EAvg: Round((2*([ED]+[B])+3*[EQ]+5*[ET])/10,1)
Be careful to have matching parentheses and to use a comma before the 1.
(You can copy and paste these expressions if you are careful to copy the whole expression!)
- Save As Q6WeeksGrades-Round.
-
Run the query.
The datasheet now shows rounded values. Much easier to read. 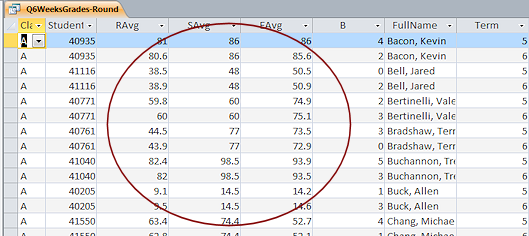 Problem: Averages are in integers with no decimal part.
Why: You omitted the comma and the 1.
Solution: Edit the formula.
- Close the query.
Compact and Repair the Database
You have done a LOT of work. The file is almost certainly fragmented on your Class disk.
- View the database properties.
 Access 2007:
  Office button> Manage > Database Properties > General tab


 Access 2010, 2013, 2016: File > Info > View and edit database properties > General tab
What is the current file size for this database? Mine was 1.80MB (1,892,352 bytes).
- Compact and Repair
Database.
Access 2007: Office button> Manage >Compact and Repair Database
Access 2010, 2013, 2016: File > Info > Compact and Repair Database
Access will close the database first. After a pause while Access is repairing and rewriting the file, the database will re-open. The larger the file, the longer the wait. Be patient!
- View the database properties again.
What is the new file size? Mine shrank to 1.30MB (1,368,064 bytes) That's only 72% of what it was before compacting. Neat!
What's in the Database Now?
Document the Database
There are far too many tables and queries to document all of them! Some were saved just so you could show your instructor that you did the work. You will print just enough of what you've done to show that you know how to print and use the documentation.
-
 Relationships:
 Print the Relationships report from the Relationships window in
Landscape orientation.
Print the Relationships report from the Relationships window in
Landscape orientation.The file name in the report header includes your own name.
(Access will not remember the orientation. You must change the defaults every time. )
)
-
 Table
Datasheet:
Table
Datasheet:
Open the Print Preview for the table Students.
Whoops. A whole row does not quite fit in the width available. A second page prints to get the rest of the Notes field, even though no text was actually cut off. Overkill!Change the margins in the Page Setup to half an inch left and right.
If necessary, resize columns so that all values are readable and the row fits across one sheet.
Access will not let you adjust the header and footer for these reports.
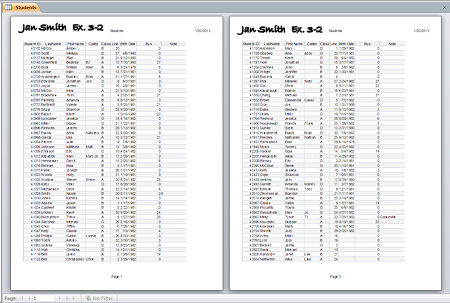
Print the datasheet of the table Students.
(2 or 3 pages)
Write your name and "Ex. 3-2" at the top left of each page -
Documenter report: Table
Create the Documenter report for the Students table. (6 or 7 pages) Print.Write your name and "Ex. 3-2" at the top left of each page.
Highlight or circle the answers to the following questions on the report:
- Record count
- Data type and Field Size for Class field
- Related tables
- Type of relationship with Six Weeks
Grades table
-
Documenter report: Query
Select the query QAverageScores in the Documenter dialog.Click the Options buttons and change the Options so that the document will not include any of the permissions or index information.
 Access will remember
your Options choices for the next time your print a Documenter report. Create and print the report. (4 or 5 pages)
Access will remember
your Options choices for the next time your print a Documenter report. Create and print the report. (4 or 5 pages)Write your name and "Ex. 3-2" at the top left of each page.
Highlight or circle the answers to the following questions on the report:
- What are the criteria in the SQL statement?
- Which fields are Text data type?
- How many indexes are there?
- How many fields are involved in some index?
-
 Object
Dependencies:
Object
Dependencies:
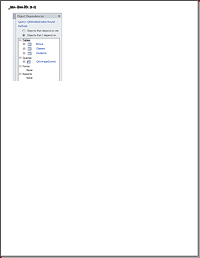
Show the Object Dependencies task pane for the query Q6WeeksGrades - Objects that I depend on.
(Access 2007 leaves out the table Classes.)Capture a screen shot of the window and paste it into Microsoft Paint, or similar graphics program.
Crop the image to show just the task pane.
Write your name and "Ex. 3-2" at the top left of the page with the Text tool.
Print the screen shot. Save to your Class disk in the folder databases project3 as ex3-2-dependencies.png in PNG format.
|
|
| © 1997-2017 Jan Smith All Rights Reserved |
Site Map What's New |
Privacy Policy Terms of Service Copyright Acknowledgements |
~~ 1 Cor. 10:31 ...whatever you do, do it all for the glory of God. ~~
Last updated: March 27, 2017
This exercise uses a file from the databases resource files.
You cannot make changes to these files and save them in the same place. Save the changed documents to your Class disk. This keeps the original resource files intact in case you need to start over or another student will be using this same computer.
 How to handle a full disk