
Jan's Working with Databases
Tables & Queries: Queries: Calculated Totals
The Totals button ![]() is a toggle button that reveals or hides the Totals row in the Query Design View.
A select query can use one of several aggregate functions in the Totals row to summarize data.
("Aggregate" just means to bring together as a whole.) This "total" does
not have to be a sum of numbers. It can be:
is a toggle button that reveals or hides the Totals row in the Query Design View.
A select query can use one of several aggregate functions in the Totals row to summarize data.
("Aggregate" just means to bring together as a whole.) This "total" does
not have to be a sum of numbers. It can be:
-
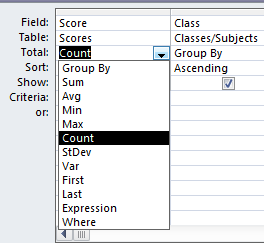 Group By - to group
the results on each unique value in the selected field
Group By - to group
the results on each unique value in the selected field -
Sum - add up the values in this field
-
Avg - average the values
-
Min - find the smallest value
-
Max - find the largest value
-
Count - how many records are the same for this field
-
StDev, Var -Statistical functions that you are not likely to use
-
First, Last - to find the first or last record in the datasheet after the query is run. Useful for large datasheets when Min or Max are not appropriate.
-
Expression - when the field is calculated using another field that is an aggregate function
-
Where - for fields that have criteria for restricting which records are included
Rules for Creating an Aggregate Query:
-
Include the field that you are "totaling" in the design grid
-
Include the fields you need to group, sort, or filter.
-
Check the box for Show only for the totaled field and for the fields you want to group on.
-
Do not include any other fields.
-
You can not use the * to include all fields.
-
The order of the fields is important for grouping and sorting
 Example: Aggregate Function - Count
(from LanguageArtsClasses.accdb)
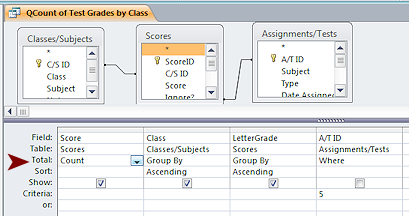
Question: How many A's, B's, etc. are there on the spelling test on Unit 24 for each of the three classes that took the test?
How to find the answer: Use a query that uses the aggregate function Count. Group records based on each class and each letter grade. I needed 3 tables in the query design grid - Classes/Subjects, Scores, and Assignments/Tests- and 4 fields - Score, Class, LetterGrade, and A/T ID.
Total Row: In the query's Total row I chose Count for the Score field and Group By for Class and LetterGrade, and Where for the A/T ID field.
Criteria: The Criteria row for the Type field contains "5",
which is the ID number for the particular test we are looking
at. The Show box is
automatically not checked for the columns that use Where in the Total row.
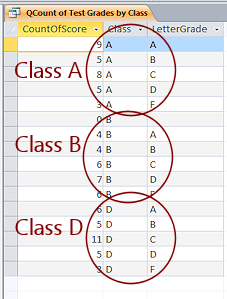 Results: After
running the query, the datasheet shows a CountOfScore value, grouped by class (A, B, D) and then by letter
grade (A, B, C, D, F). (Yes, it is confusing to have named
the class sections with letters. It was not my idea!) So we can say that in class A
there were 9 A's and 5 B's, etc. In class B there were 4 A's, 4
B's, etc. But what is that first entry for class B - CountOfScore=0 and no letter
grade?? There was at least 1 score that was Null. A null score would be a
record that exists for
a test but the score has not been entered yet. The Count function won't
tell us how many of those there were. Strange!
Results: After
running the query, the datasheet shows a CountOfScore value, grouped by class (A, B, D) and then by letter
grade (A, B, C, D, F). (Yes, it is confusing to have named
the class sections with letters. It was not my idea!) So we can say that in class A
there were 9 A's and 5 B's, etc. In class B there were 4 A's, 4
B's, etc. But what is that first entry for class B - CountOfScore=0 and no letter
grade?? There was at least 1 score that was Null. A null score would be a
record that exists for
a test but the score has not been entered yet. The Count function won't
tell us how many of those there were. Strange!
![]() Null Values and Functions: Different functions handle nulls differently. You must test to see what happens. The Count function did not actually count the null scores, but showed a 0 instead. That means there was at least 1 null value
in the scores for class B. If you want to know how many nulls there are, you need a different query.
Null Values and Functions: Different functions handle nulls differently. You must test to see what happens. The Count function did not actually count the null scores, but showed a 0 instead. That means there was at least 1 null value
in the scores for class B. If you want to know how many nulls there are, you need a different query.
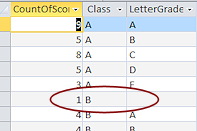 Counting Null Values: Changing the query to Count the field ScoreID instead of Score lets the query count any null scores. Small differences can make a big difference in results!
| |
Step-by-Step: Calculated Values - Totals |
|
| What you will learn: | to use the Total row to count records to open a second database while the first remains open to use the Total row to sum and to average to group a total's results on a calculated field |
Start with: ![]() , Projects database (projects2-Lastname-Firstname.accdb) from previous lesson open, mytrips-Lastname-Firstname.accdb available (created in Project 2: Access Basics)
, Projects database (projects2-Lastname-Firstname.accdb) from previous lesson open, mytrips-Lastname-Firstname.accdb available (created in Project 2: Access Basics)
Calculate Total: Count
You will create a query to answer the question "How many staff members are assigned to each project?" You will need a Total query that uses the Count function to count employees. You will group the results on ProjectName or ProjectID.
- If necessary, open the database projects2-Lastname-Firstname.accdb .
-
 Start a new query using the Query Design button
  on the Create ribbon tab.
The Query Design View appears with the Show Table dialog open.
-
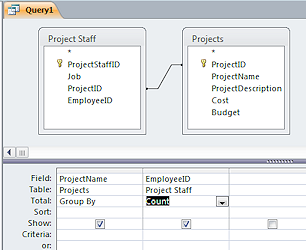 Select the tables Projects and Project Staff and click Add.
The two tables are added to the upper section of the Query Design View with a join line based on the relationship that you defined between them earlier.
-
Close the Show Table dialog.
-
From the table Projects drag the field ProjectName and drop it on the grid at the bottom.
-
From the table Project Staff drag the field EmployeeID and drop it on the grid.
-
Click the Totals button
 in the toolbar to show the Totals row.
-
In the column for ProjectName select Group By.
In the columns for EmployeeID select Count.
-
 Run the query.
 If necessary, drag the right edge of each column until
the column is wide enough to read the values.
If necessary, drag the right edge of each column until
the column is wide enough to read the values.
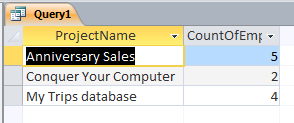
The datasheet shows how many employees are assigned to each project in the database. The projects you recently added have not had staff assigned yet.
-
 Save the query as QCount Project Staff.
-
Close the query but do not close the database yet.
Open a Second Database
The Projects database does not yet have any number fields that are suitable for adding up or averaging. The MyTrips database that you created in Project 2 does. Recall that to open a second database without closing the first one requires you to first open a new instance of Access. Various methods were discussed in Project 2, Access Basics: Open Access.
-
Do not close the Projects database.
Open a new Access window.
Method 1: >or>>
Method 2: Right click the Access icon on the Taskbar. Because you left Access open, you have such an icon even if Access is not pinned to the Taskbar. Click on Access in the popup menu.
A new Access window appears. -
 Access 2007: Click on the Office button and then on Recent file.
 Access 2010: Click on Recent files
 Access 2013, 2016: Shows recently used files on the left when Access first opens.
 -
Click on mytrips-Lastname-Firstname.accdb, if it is in the list.
 Problem: File is not in list of Recent files or you see an error message
You have opened too many databases for this one to show.
Or you recently removed the Class disk and reconnected it, resulting in a different drive letter being assigned to it.
Solution: Click on the link Open and navigate to where you saved it in the databases project2 folder on your Class disk at the end of Project 2 of these lessons. Click the file and then the button Open to open it.Problem: List has more
than one mytrips-Lastname-Firstname.accdb
Cause: You have copies in more than one location and opened them all in Access recently. Or you removed and reconnected the drive and a different drive letter was assigned to it.
Solution: Hover over each of the entries in turn. A screen tip shows the path to that file. Decide which copy is your current copy. You can easily find yourself with two very different versions, none of which are fully correct. So confusing!
You may need to use the Open command and navigate to the most current location.Problem: Computer
slows down with two copies of Access open
If your computer responds very slowly with a second copy of Access open, you may not have enough memory to handle two copies at once.
Solution: Close the Projects database to allow you to work in the MyTrips database.
Calculate Totals: Sum and Average
You will create a new Totals query in the MyTrips database and experiment a bit with it. You will make changes to answer the following questions:
- What is the total cost of all the trips?
- What is the average cost of a trip?
- What is the total cost of trips by each travel agent?
 From the Create ribbon tab, click on the Query Design button.
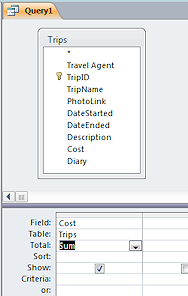
- Add the Trips table.
- Drag the Cost field down to the grid and drop it.
- Click on the Totals button to
show the Totals row.
- In the Totals row for the Cost field, select Sum.
-
 Run the query.
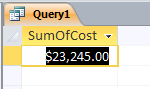
The datasheet has only 1 cell, which shows the sum of all the values in
the Cost field.
-
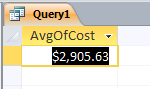 Return to Query Design View and change the Totals row
to Avg, for average.
Return to Query Design View and change the Totals row
to Avg, for average.
- Run the query.
Again there is only one cell showing, with the average of the Cost value for all trips.
-
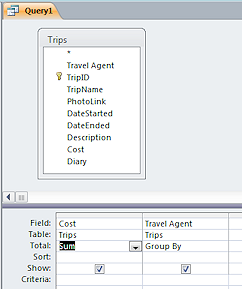 Return to Query Design View and drag the field TravelAgent down to the grid.
It automatically shows Group By in the Totals row.
- Change the Total choice for the Cost field
back to Sum.
- Run the query.
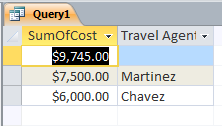 This
time you see values for each travel agent and one for trips when no
agent was used.
This
time you see values for each travel agent and one for trips when no
agent was used.
The TravelAgent field shows the last name of the agent instead of the ID number because this field is a Lookup field and you had not learned how to make it show the whole name back in Project 2.
- Save the query with the name QTotals-Trips by Agent.
-
 Experiment with different choices for the Total row and with
different fields. What happens when you:
Experiment with different choices for the Total row and with
different fields. What happens when you:
- Sum on a text field.
- Group By more than one field.
- Group By a different field.
- Drag the * from the table to the grid and do a total.
- How could you restrict the query to not show a sum when there was
no travel agent?
- Close the query without saving your changes.
Group Total Results on a Calculated Field
You can combine what you have learned about the Total feature and the IIf conditional expression to create a calculated field that will group your results in a new way. This is starting to get fun! (Or complicated, depending on your point of view!)
First you will create a Totals query that will Sum the values in the Cost field.
Then you will create a calculated field that will group the trips based
on whether they were before the year 2000 or not.
Syntax for IIf expression:
IIf(<expression to evaluate>, <what to show if
expression is true>, <what to show if expression is false>)
- In the MyTrips database, create a new query based on the table Trips.
-
 Drag the field Cost from the list of fields in the Trips table down to the grid.
 -
Show the Totals row, by clicking the Totals button
.
-
For the Cost column, select Sum for the Total row.
-
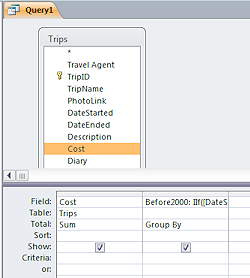
To create a calculated field, type the following into the Field row of the second column:
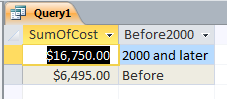
Before2000: IIf([DateStarted]<#1/1/2000#,"Before","2000 and later")Be sure to include all of the punctuation, the hash marks (#) around the date, and the double quote marks around the text strings.
This calculation returns the value "Before" if the DateStarted is before the year 2000 and a "2000 and later" otherwise.
The Total row shows Group By since that is the default choice.
-
 Run the query.
The Cost values are added together for two groups, start dates before
2000 and those in 2000 and later.
-
Save your query as QTotals-Trips-2000
-
Close the database MyTrips and then the blank Access window, if there is one.
The Projects database is still open.
|
|
| © 1997-2017 Jan Smith All Rights Reserved |
Site Map What's New |
Privacy Policy Terms of Service Copyright Acknowledgements |
~~ 1 Cor. 10:31 ...whatever you do, do it all for the glory of God. ~~
Last updated: March 27, 2017