|
Totals for Fields
Your report can easily show totals like sums, averages, and counts based
on the fields in the report's source. You can total each group in a Group Header or
Footer. You can total the whole report in the Report Header or Footer.
How to put a total in a report:
- Create an unbound text box control in a header or footer.
- Set the control source for the new control to an expression
that calculates the total that you want.
General Syntax: =Function([FieldName])
Examples: =Sum([Price])
or =Avg([Price]) or
=Max([Price]) where the
field named Price is in the report's source.
The field that you are totaling is usually shown in
the Detail section but does not have to be.
What will be totaled: Group or Report?
It depends on which section you put the
new control. If it is in a group header or footer, then the total is over
that group only. If it is in the report header or footer, then the total
is for the whole report.
 Special Case: Counting
records with Count(*) Special Case: Counting
records with Count(*)
For counting records, it is almost always better to use the expression
=Count(*) instead of an expression based on a field name, like =Count([Price]).
The two expressions do not produce exactly the same results. =Count([Price]) will not count
records that do not have a value in the Price field, but
=Count(*) will! You almost always will want to count ALL records.
 Totals Per Page? The method above will
not work to calculate totals on a page. Such a total cannot be calculated until after the report is
formatted for print. So, the page header and footer will not accept an
aggregate function like Sum or Avg or Count. It is possible to use Visual Basic code to
create page totals. Totals Per Page? The method above will
not work to calculate totals on a page. Such a total cannot be calculated until after the report is
formatted for print. So, the page header and footer will not accept an
aggregate function like Sum or Avg or Count. It is possible to use Visual Basic code to
create page totals.
Example:
One Group Level with Sum
To
sum the price paid for all the items in a group, you can add a new
unbound control to the group footer.
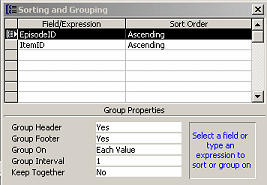
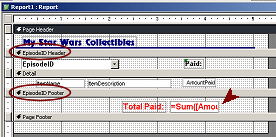
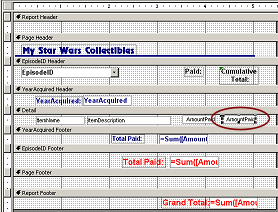
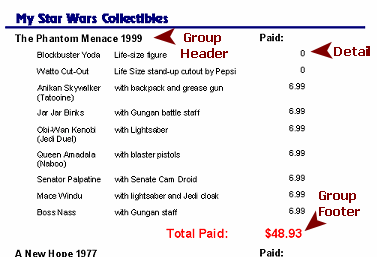 In the illustration
from the Star Wars Collectibles database, the new control is in the group footer. The
control source for the new control is =Sum([Amount
Paid]) where the field named Amount Paid is
in the report's source. The field is usually shown in the Detail section,
but does not have to be anywhere in the report for the total to work! In the illustration
from the Star Wars Collectibles database, the new control is in the group footer. The
control source for the new control is =Sum([Amount
Paid]) where the field named Amount Paid is
in the report's source. The field is usually shown in the Detail section,
but does not have to be anywhere in the report for the total to work!
The
report shows a total in the footer for each group.
Example: Two Group Levels with Sum & Grand Total
When you have two or more group levels, you can do totals for each group
level. The report as a whole can also have a total.
 Label the totals clearly so
you can tell which total goes with which grouping. Staggering the totals
across the page usually helps. Formatting different levels differently
and/or using divider lines also helps. Label the totals clearly so
you can tell which total goes with which grouping. Staggering the totals
across the page usually helps. Formatting different levels differently
and/or using divider lines also helps.
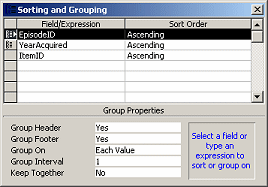
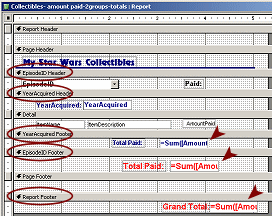
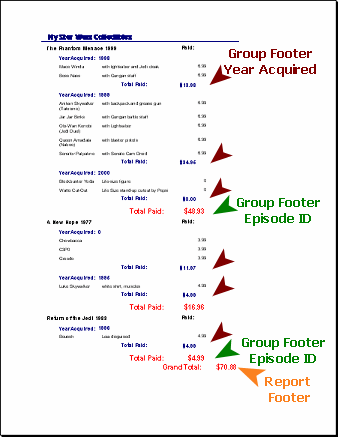 The
Sorting and Grouping dialog shows 2 groups and one additional sort. The
same calculation goes in each of the three controls for totals The
Sorting and Grouping dialog shows 2 groups and one additional sort. The
same calculation goes in each of the three controls for totals
=Sum([Amount Paid]).
Access figures out which records should be totaled for each subtotal.
Group Headers/Footers are so helpful!
The report shows a subtotal for each group of years within each
episode, a subtotal for each episode, and then a grand total for the whole report. The order of
fields in the dialog is important!
Example: Running Sum
A
running sum shows a total that increases with
each record or group. The example below shows a current total with each
record.
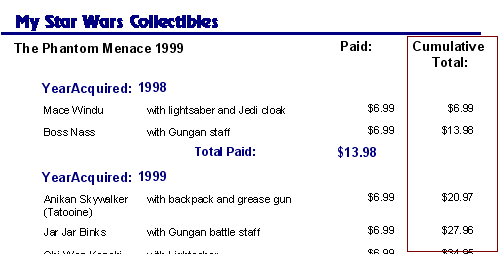
You use the Running Sum property for a control to make it accumulate
values. You can accumulate over a group (Over
Group) or over the whole report (Over All).
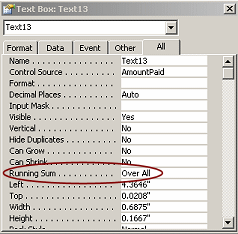
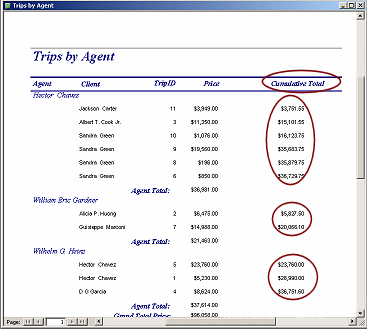
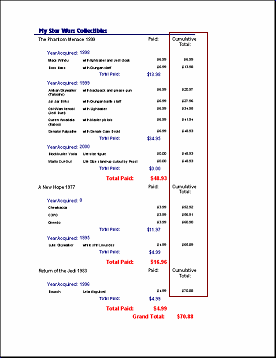 The illustration shows a running sum
for each record in the column Cumulative Total at the right. The control
uses the same control source as the control in the Paid column, the
field AmountPaid. The two controls have
different names but the same source. The total is accumulating over the whole report. The illustration shows a running sum
for each record in the column Cumulative Total at the right. The control
uses the same control source as the control in the Paid column, the
field AmountPaid. The two controls have
different names but the same source. The total is accumulating over the whole report.
 Use
Running Sum to number each record: Use
Running Sum to number each record:
-
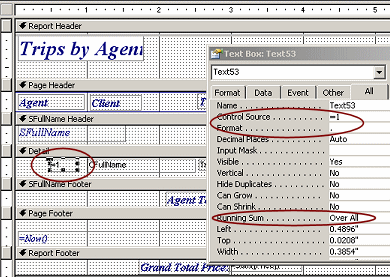
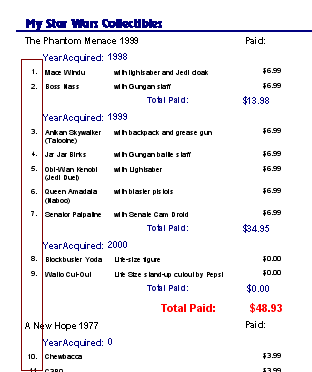 Create an unbound text box control in Detail Create an unbound text box control in Detail
- Set Control Source to =1.
- Set Running Sum property to Over All
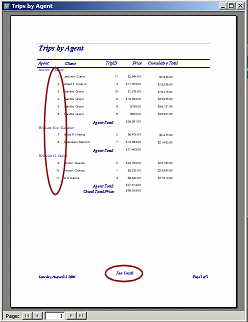
to continue numbering in sequence for the whole report, as in the
illustration.
Set Running Sum to Over
Group to restart numbering with each group.
- Type a period (.) in the Format property to append a dot to each
number, as in the illustration.
 |
Step-by-Step: Totals - Simple |
 |
|
What you will learn: |
to count records in groups and the whole report
to edit the report's source in Query Builder
to manage sorting with the Sorting and Grouping dialog
to create simple total of field values for group and whole report
to create a running sum in the Detail section
to number records with Running Sum |
Start with:
 ,
resource files,
worldtravel.mdb, report
Clients - by country and postal code from the
previous lesson,
Trips table and QFullName-Staff
query imported in previous
lesson ,
resource files,
worldtravel.mdb, report
Clients - by country and postal code from the
previous lesson,
Trips table and QFullName-Staff
query imported in previous
lesson
World Travel Inc. wants your report
to show how many clients are in each country. You need to add totals to your report.
For this report the Count(*) function will work well. After finishing
up the client report, you will create another report based on the Trips
table and create some simple totals for it.
Count Records:
Using Count(*)
The easiest way to count records is to use the special
function Count(*).
If necessary, open the report
Clients - by country and postal code
from the previous lesson.
In the Sorting and Grouping dialog, change
the PostalCode group to show a footer.
Country already is showing a footer.
Click on the Text Box button
 o
n the Toolbox bar. o
n the Toolbox bar.
The pointer changes to the text box shape
 . .
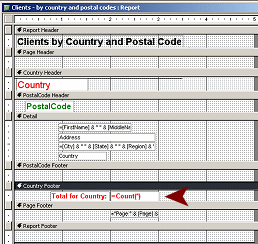
Click in the Country footer at about the
2" mark.
Type in the label for the new
control: Total for Country:
- In the new control, type =Count(*)
(Alternatively: Type in the Control Source
property in the Properties dialog)

- Format the label:
Font Size = 10
Bold
Color = Red
-
 With the label selected, click on the Format
Painter button With the label selected, click on the Format
Painter button
 . .
- Click on the text box in the Country Footer.
The formatting of the label is applied
- Resize the label and text box to AutoFit.
- Arrange the label and text box around the 2"
grid line.
-
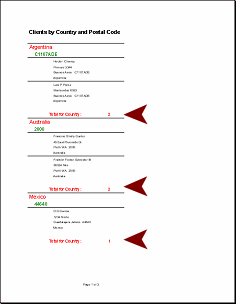 Switch
to Print Preview. Switch
to Print Preview.
Each Country group now has a count total.
 Point of Confusion:
Alignment Point of Confusion:
Alignment
The total's text box in Design View looks like it is aligned to the left. The
totals in the report are aligned at the right. The actual total values
are numbers, which are aligned by default at the right. In the Design
View you see an expression, which is text. Text is aligned by default
to the left. Confusing!
- Switch to Report Design View.
- Similarly, add a total to the
PostalCode footer that counts the number of records in each
group.
- Format this new total to coordinate with the
PostalCode header:
Font Size = 10
Bold
Font Color = Green
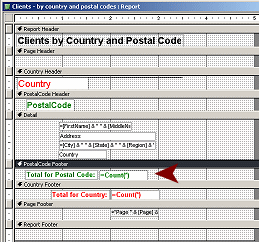
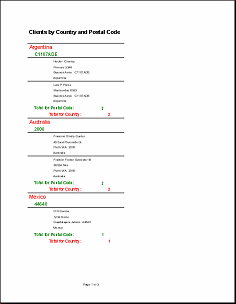
- Switch to Report Design View and add a new
text box to the Report Footer.
-
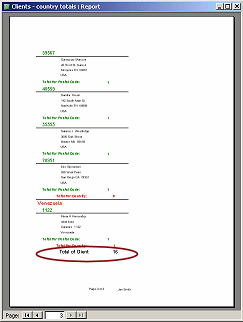 Edit
the label to read: Edit
the label to read:
Total of Clients:
- Edit the text box source to read:
=Count(*)
- Format the control and its label to coordinate with the
report header as:
Font Size = 12
Bold
Font Color = Black
- Switch to Print Preview and navigate to the
last page.
The report footer with the report total appears at the end of the
report.
- Make any necessary corrections.
 Save
the report as Clients - country totals. Save
the report as Clients - country totals.
 Print the last page only.
- Close the report.
Start a Report with the Wizard
The Clients table has no number fields
to use for doing numerical calculations. We must change to a different table to
learn how to do that in reports. The Trips
table is suitable. You imported this table along with some others and
some queries from another database in an
earlier lesson.
- Start the Report Wizard.
- From the Trips table include:
TripID, ClientID, AgentID, DiscountID, Price
- From the table Discounts include:
Discount %
- From the table Clients include:
LastName, FirstName, MiddleName
- From the query QFullName-Clients
(imported in an earlier lesson) include:
CFullName
- From the query QFullName-Staff
(imported in an earlier lesson)
include:
SFullName
- Choose to group on SFullName.
- Sort on LastName, FirstName, MiddleName,
which are the client's name.
- Choose Stepped layout in Portrait orientation.
- Choose Corporate style.
- Name the report Trips by Agent.
-
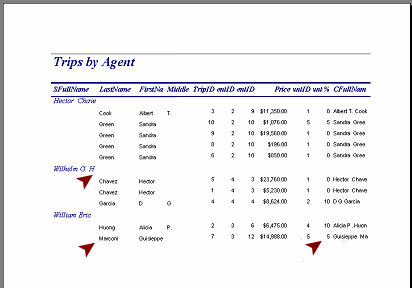 Inspect
the report. Inspect
the report.
This is a start, but it needs a lot of work, like most wizard reports.
Problems:
Some of the column labels are cut off.
The trips are grouped by the agent, but the control for the agent's name
is too narrow.
You don't need both the client's full name and the individual name
fields.
Customize Report
- Switch to Report Design View.
-
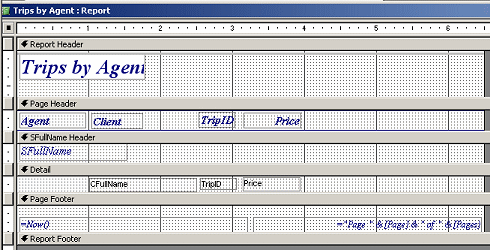 Delete
the label and control for: Delete
the label and control for:
LastName, FirstName, MiddleName, ClientID, AgentID, DiscountID,
Discount %
- Edit the SFullName column label to read
Agent.
Edit the CFullName column label to read
Client.
- Move the CFullName control and
its matching column label to the position that
LastName had before you deleted it.
-
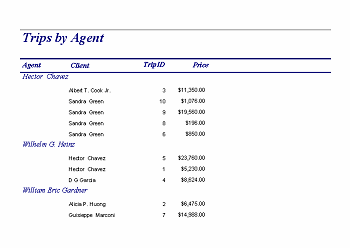 Enlarge
the controls for the agent and client names to at least 1.5" wide. Enlarge
the controls for the agent and client names to at least 1.5" wide.
- Move the TripID and
Price controls and their column labels over
to the left next to the Client control and
column label.
- Switch to Print Preview.
- Inspect.
Better.
The agents are not alphabetized correctly. The query
QFullName-Staff
did alphabetize these names, but the report is not picking it up. The
client names would have the same problem but we included the original
name parts in the wizard and sorted on them. Confusing!
Did you notice? The report title shows fine in the preview, but
in the Design View it looks cut off.
Revise Report's Source in Query Builder
The Report Wizard created a query that is the report's source. You can edit that query yourself in the Query Builder
window. Let's try to fix the sorting of the agents by changing the query.
There will be a glitch! Do not panic. Keep reading. All will be
explained.
- Switch to Report Design View.
- Click on the upper left corner of the report window to select
the whole report.
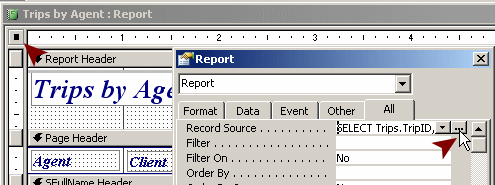
- In the Properties dialog, click in the Record Source
box and then on the ellipsis button
 that appears.
The Query Builder window appears. It shows the tables and queries and
the fields chosen for the query that is the control source for the
report.
  Problem: Changed record source unintentionally
It is easy to click on the arrow instead of the ellipsis button.
That action drops a list of tables and queries that you can choose as
the source. If you select one of those, the current query is lost.
Controls that are based on fields that are no longer available will show
a green error triangle. You can use Undo to get it back, but not if you
have done too many other things in the meantime.
- Delete the Discounts table,
since we are no longer using those fields.

- From the QFullName-Staff list,
drag the fields LastName,
FirstName, and MiddleName
to the grid.
(Be sure that the Table row shows the correct source. The
Clients table
also has fields with these names!)
-
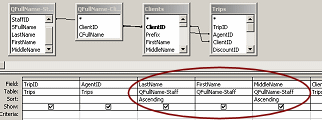 Sort
these new columns Ascending. Sort
these new columns Ascending.
- Click the close button on the toolbar. When
prompted, save the SQL statement.
You are back in Report Design View.
 If you click
the Save button on the toolbar, you are prompted to save your design as
a separate query. Not what we need! If you click
the Save button on the toolbar, you are prompted to save your design as
a separate query. Not what we need!
- Switch to Print Preview.
Glitch!
A message box appears. There is some confusion about the two
LastName fields in your query, even though we
had to pick which table they came from. <Grrrr!>

- Click on OK.
The report fails to open!
- Open the Query Builder again.
You can fix this glitch by assigning new names.
- Rename the name columns for Staff names by replacing as follows:
SLast: LastName
SFirst: FirstName
SMiddle: MiddleName
- Close the Query Builder and save your changes.
-
 Switch to Print Preview. Switch to Print Preview.
It opens. That part is better!
You have learned how to revise a report's source.
But the report still does not sort
the agent's name properly. Humph!
The problem is not with the query but with the Sorting and
Grouping dialog.
Manage Sorting
The Sorting and Grouping dialog is the primary controller for sorting
in a report. It is over-riding what you did in the record source query.
You must include in the report's source all of the fields
that you want to use in the Sorting and Grouping dialog. The
sorting in the original source table or query may not be what you see in
the report.
-
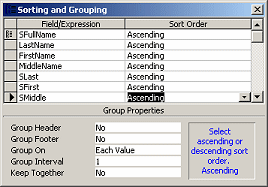 If
necessary, open the Sorting and Grouping dialog. If
necessary, open the Sorting and Grouping dialog.
- Inspect the rows.
The group SFullName is being sorted
ascending, but that field holds a complete name, starting with the first
name. Aha! So the Agents ARE in alphabetical order, but starting with the
first name. That's not the alphabetical order that we wanted!
You can fix that, now that you have included the fields that make up the
full name in the report's control source.
(See. You did not waste that effort above!)
- Add rows for SLast,
SFirst, and
SMiddle, sorted Ascending.
- Switch to Print Preview.
No change. Hmmm. Why not? This time it is the order of the
sorting that is the problem.
- Switch to Report Design View.
-
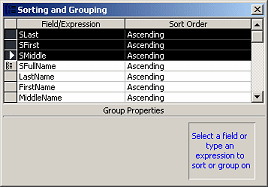 In
the Sorting and Grouping dialog, drag the staff name rows that
you just added up above the SFullName row. In
the Sorting and Grouping dialog, drag the staff name rows that
you just added up above the SFullName row.
The dialog still shows that SFullName is sorted. But, the values are
being sorted within a grouping on SLast/SFirst/SMiddle - which only has
1 member. So there is no effect.
-
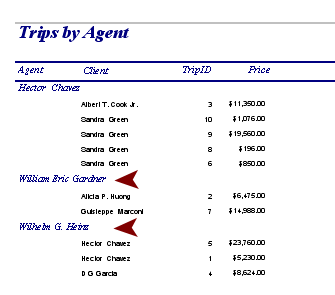 Switch
to Print Preview. Switch
to Print Preview.
Success! The agents are now in alphabetical order.
Now that the groupings are straightened out, we get do some work with
totals, which was the point of this lesson!
 Save
the report as Trips by Agent-sorted. Save
the report as Trips by Agent-sorted.
Create Simple Total
You can easily do totals for values directly from fields. The next
lesson will work on how to do totals with calculated controls.
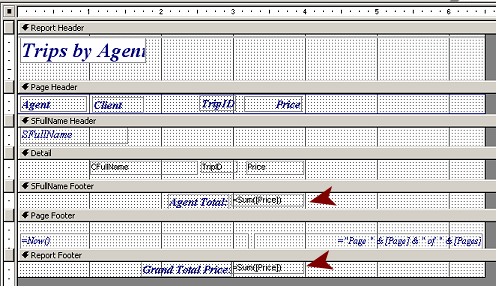
- In the Sorting and Grouping dialog, show the footer
for the group SFullName.
- Create in the footer a new unbound text box
control using the Text Box tool.
- Change the label to read Agent Total:
- In the Properties dialog for the new control, change:
- Name to TotalPrice.
- Control Source to
=Sum([Price])
- Format to Currency
- Copy the TotalPrice control
- Click on the Report Footer bar to select the
section.
- Paste.
The control is pasted into the Report Footer, which
automatically enlarges.
- Change the name of the control in the Report
Footer to GrandTotalPrice.
- Switch to Print Preview.
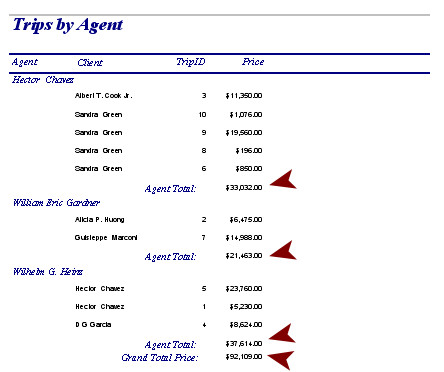
The report includes a total for each grouping and for the whole
report.
 Save
the report as Trips by Agent - Total Price. Save
the report as Trips by Agent - Total Price.
Create a Running Sum
While it is not particularly interesting for this report, let's
practice creating a running sum in the Detail section. This method can be
used for situations where you want to total a calculated control (as we
will do in the next lesson).
- Switch to Report Design View.
- In the Detail section, create a new unbound text box
to the right of the Price control.
- Use the key combo CTRL + X to delete the control's label.
- Click in the Page Header and paste. The deleted label
appears at the upper left.
- Drag the pasted label to the right to be a column label above
the new text box.
 Where it pastes: Objects
pasted in Design View appear at the upper left of the section that was
selected when you pasted. They can be hard to see if they overlap
other objects or are small, like thin lines. Where it pastes: Objects
pasted in Design View appear at the upper left of the section that was
selected when you pasted. They can be hard to see if they overlap
other objects or are small, like thin lines.
- If necessary, align the new label with the other
labels in the Page Header section.
- Edit the label text to read
Cumulative Total
-
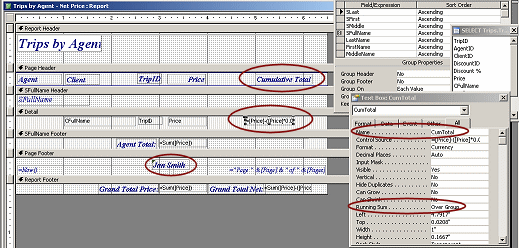
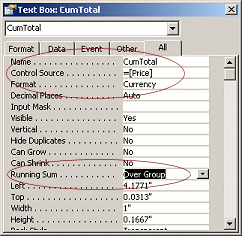 In the Properties dialog, In the Properties dialog,
- Name the new control in the Detail section
CumTotal.
- Set the control source for the new control to
=[Price].
- Set Format to Currency.
- Set the Running Sum property to Over
Group.
-
Add a
label to the center of the Page Footer containing your name.
-
 Switch to Print Preview. Switch to Print Preview.
The new column shows a total that increases with each new record in the
group. The last record in a group will have the same total as the
group's total, which was calculated separately.
In this report the column resets to zero for each new group. If the
Running Sum property for the control is set to Over
All, then the total will not reset but will keeping accumulating
for the whole report .
 Save
the report as Trips by Agent - Cumulative
Price Save
the report as Trips by Agent - Cumulative
Price
Number Each Record
The Running Sum property can be used to number each record, either
within a group or over the whole report.
-
 Switch to Report Design View. Switch to Report Design View.
- Add a new unbound text box control to the Detail view, at the
left for the client name.
- Delete the label for the new control.
- Align the new control with the top of the other Detail
controls.
- In the Properties dialog for the new control, change the following:
- Control Source to =1
- Format - type a period
- Running Sum to Over All
-
  Save
the report as Trips by Agent - Numbered Save
the report as Trips by Agent - Numbered
 Print. (1 page)
|

