|
Why use a report?
- To distribute information to others who cannot see the database
- To have a static record of the values at a specific date/time
- To group records
- To produce summaries (report totals, group totals, running totals)
- To show all controls for a record together
- To have precise control over the organization and look of your output
Types of Reports
There are several basic types of reports, with uncountable variations.
-
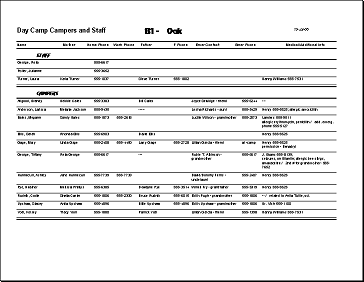 Detailed - Lists all of the records from the report source. Detailed - Lists all of the records from the report source.
Records can be grouped based on values or partial values from a field or
expression, like
the first letter, or on intervals like for a month or week.
Example:
- Camper and Staff info grouped by camp unit and on the
field Staff
(Yes or No).
-
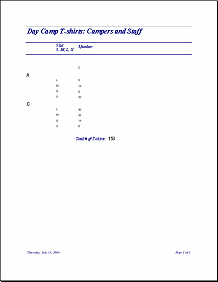
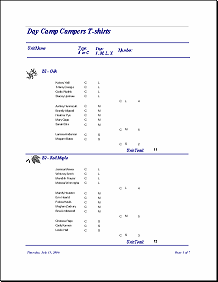
Summary - Can include report totals,
running totals, and group totals. Can show
only the summary data with no records at all. A "total" can be any aggregate function, including average, count,
maximum, or minimum as well as sum.
  Examples: Examples:
- Camper names with totals for size of T-shirt needed, grouped by size within each
camp unit.
- Count of T-shirts by sizes, for whole camp - no Detail section showing
at all
-
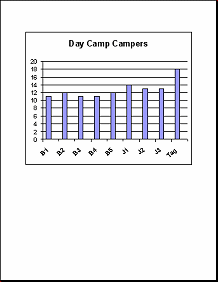  Specialty reports Specialty reports
Examples:
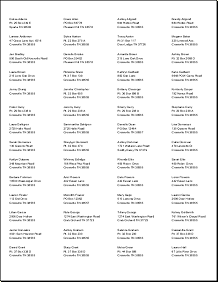
- Mailing labels
- Chart
-
  Report
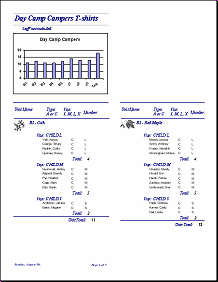
with columns Report
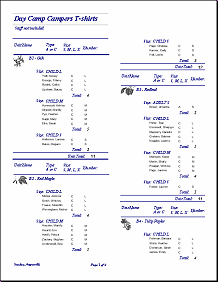
with columns
Group header kept with First Detail only
-
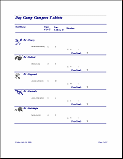
Report with subreport (in report header);
Group header kept with Whole Group.
Views
There are three separate views of a report. There is no "Report View"
since that would be the same as the Print Preview.
-
   Report
Design View Report
Design View
- Print Preview
- Layout Preview
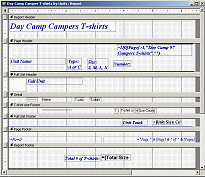
Report Design View

Report Design View looks much like Form Design View. You create controls
the same way, dragging fields from the Field List and using the Toolbox
tools to create unbound controls. You use the Properties dialog to manage the look and behavior of
controls, report sections, and the whole report. Each section can be no
more than 22" tall and the report can be no more than 22" wide. All
sections will be the same width, which can be an aggravation!
Report sections available:
Each section has its own selection bar running across the design
window.
-
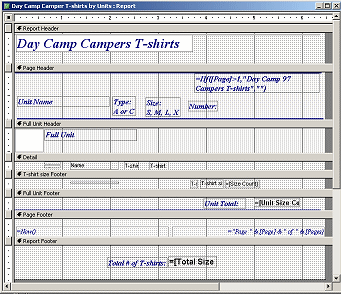 Report Header/Footer - Prints at the beginning/end of
the whole report. Your report title goes in the Report Header. Grand
totals usually go in the Report Footer, as in the illustration. Report Header/Footer - Prints at the beginning/end of
the whole report. Your report title goes in the Report Header. Grand
totals usually go in the Report Footer, as in the illustration.
- Page Header/Footer - Prints on each page. Page numbers go here,
usually in the footer. Since the report title won't show after the first
page, you will often want a secondary title in the Page Header.
- Group Header/Footer - Prints at the beginning/end of a
group of records. A group is named for the
field or expression which is used to group the records. A report can have
up to 10sorting or grouping levels.
Each group can have its own header and footer. The illustration shows two
groups, with one Group
Header (Full Unit) and two group Footers (Full
Unit and T-shirt size).
- Detail - Shows the data for a single
record. The Detail section repeats for each record in the group.
 Methods to hide a section: Methods to hide a section:
- Properties Dialog: Set the Height of the section to zero.
- Report Design View: Drag the bottom edge of the section up to
meet the top edge. If there are controls in the section, either delete
them or resize them vertically to zero height.
- Sorting and Grouping dialog: Choose "No" for a
Group Header or Group Footer. This also hides the section
selection bar in Design View AND deletes any controls that were in the
section(!). In the illustration, the group header for
T-shirt size was hidden with this method. (More below on the dialog)
Sorting and Grouping
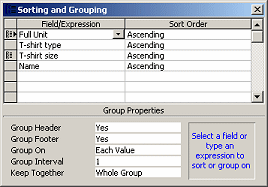 A
feature just for reports, there is a new button on the toolbar A
feature just for reports, there is a new button on the toolbar
 that opens a new dialog, Sorting and Grouping.
This dialog allows you to pick fields to sort and group on, without having
to make changes in the source for the report. You have lots of control over
how the grouping behaves.
Print Preview

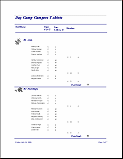
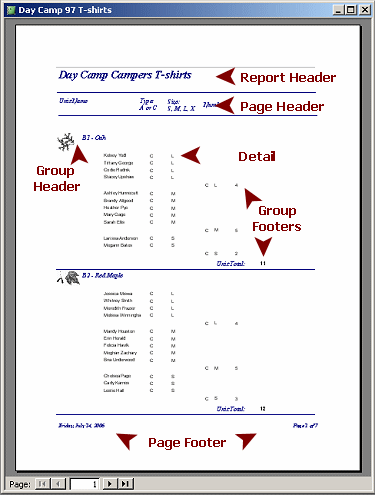 Print Preview shows how your whole report will print. The
illustration shows some of the sections that you might have. Of course,
different reports will use different combinations of the possible sections. Print Preview shows how your whole report will print. The
illustration shows some of the sections that you might have. Of course,
different reports will use different combinations of the possible sections.
Report Header: Shows only on the first page.
Page Header and Footer: Show on every page. Page header will be
below the Report Header on the first page. Page Footer will be at the
bottom of every page.
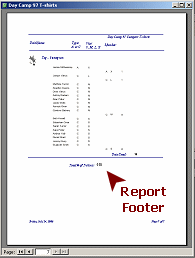
Report Footer: Shows only on the last page, below the last group footer.
Navigation in Print Preview:
-
 Can't
scroll to next page: Unexpectedly, you cannot scroll from page to
page. You must use the navigation buttons at the bottom of the preview
window or the arrow keys to change pages. Can't
scroll to next page: Unexpectedly, you cannot scroll from page to
page. You must use the navigation buttons at the bottom of the preview
window or the arrow keys to change pages.
- Slow formatting: Any queries that are part of the report's source must run before the
report can be displayed. For some reports this can take a long time. You
want to avoid using queries that are based on queries that are based on
other queries! Keep it as simple as possible.
- Skipping pages in
navigation: Access must format each page as you advance through the report. If you
skip to later pages by typing in a page number, Access still has to format
the pages in between. This can take a while for long reports or report with
photos. (Unfortunately, it doesn't really help to jump to the last page and then go backwards
through the pages!)
- Total number of pages: The total number of pages does not show in the Print Preview window
anywhere. You can click on the Last Page button and look at the navigation
bar for its page number. But, you must wait for the entire report to format. This
can take a while if there are a lot of pages!
 Better: Put a control in the page header or footer that shows the total number of
pages as well as the current page number. That way you will be able to see
the total number of pages from the first page! Better: Put a control in the page header or footer that shows the total number of
pages as well as the current page number. That way you will be able to see
the total number of pages from the first page!
Layout Preview

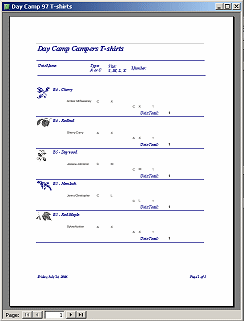 Layout Preview shows a sample layout with all of the sections that
you chose for the report, but it uses
only a few random records. This
view is good ONLY for checking the general appearance of your report. It
does not give you any idea of how many records there will be in each Group. Layout Preview shows a sample layout with all of the sections that
you chose for the report, but it uses
only a few random records. This
view is good ONLY for checking the general appearance of your report. It
does not give you any idea of how many records there will be in each Group.
Advantage: Layout Preview comes up more quickly than Print
Preview.
Disadvantages: You cannot tell if
controls are large enough for data from all records since you only
see a few. You may not see
some features that show up when there are a large number of records, like multiple columns or required
page breaks.
 In Layout Preview, the
records that are displayed may not belong to the Group they are displayed in.
No totals will be correct. It uses a random selection of data. In Layout Preview, the
records that are displayed may not belong to the Group they are displayed in.
No totals will be correct. It uses a random selection of data.
Properties Dialog
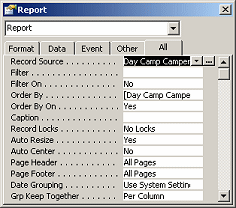 The Properties dialog works the same way for reports that it did for forms.
Report sections and controls have many of the same properties that those
items have in forms, such as Record Source, Font, Border Style, Border
Color, Background Color. There are some differences, of course. The Properties dialog works the same way for reports that it did for forms.
Report sections and controls have many of the same properties that those
items have in forms, such as Record Source, Font, Border Style, Border
Color, Background Color. There are some differences, of course. Reports have
properties that control what will print and where. For example, the
Report itself has a Page Header property, a Page Footer property and a Picture
property (background picture) for which you can choose on which pages the object will print.
On the other hand, reports do not have properties about how data is entered or edited,
which a form needs.
Reports have just a few properties on the Event tab, while Forms have a
large number of events.
Useful properties for reports that forms don't have:
- Page Header - All Pages, Not with Rpt Hdr, Not with Rpt Ftr,
Not with Rpt Hdr or Ftr
- Page Footer - same choices as header
- Grp Keep Together - Per Column, Per Page
- Picture Pages - All Pages, First Page, No Pages
Applies to
the background picture for the report that is picked in the Picture
property.
Useful properties for controls on a report that form controls don't
have:
- Hide Duplicates: Yes/No.
If Yes, the report hides a control when the control duplicates the value
in previous record's control. This works best on fields that are sorted.
It cleans up the display of the records by showing just the first
instance of a value that is repeated in the next records.
- Running Sum: No, Over Group, Over All
Used to accumulate a total over for a group or for the whole report. You
can use this property to number records in sequence by setting the value
of a textbox to =1.
|

