Jan's Working with Presentations
Advanced: Tables & Charts: Animate Data
Revealing your data in parts by using an animation effect can help your audience digest the information more easily.
Animation Sequence
Tables
- Animation sequence affects a table as a whole.
- You cannot animate a single table one row or column at a time.
Work-around: Fake it by creating a separate table for each row or column.
Charts
- Slide Master animation may affect chart, as a whole object.
- If the chart went into an empty placeholder, the chart will use the same effect as the placeholder.
- Some animations can reveal the chart by series or by categories when you choose the right options, but not all.
[This lesson page may be slow to load. It has several short videos embedded.]
Work Around: Animate a Table
By parts (rows or columns):
You can create a separate table for each row (or column) and apply animation to each one.
(Yes, it is awkward!)
How to create separate tables for each row/column:
- Create the full table on a separate slide.
You will delete this slide when you are done.
Alternate method: Create the table in Word.- Size the cells as you want them to be on the finished slide.
- Copy row (or column).
- Create a one row or one column table on the new slide, with the correct number of cells.
- Paste onto your copied cells into the new table. (Will be centered and at the top.)
- Drag into position.
- Repeat for each row (or column).
- Use Align Center or Align Middle to line up the small tables. Use one of the Distribute commands if necessary.
- Select all the tables.
- Apply an Animation effect.
- Select how you want the effect to play: On Click, With Previous, After Previous
- Delete the temporary slide, if you used one.
 |
 |
How to Animate Chart
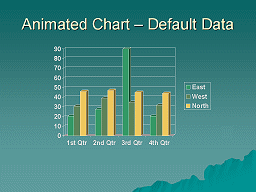
By parts (series or categories):
-
 Select
the chart.
 - Apply an animation.
- Open the Effects Options palette and choose a direction and a
sequence, by series or by category.
(You do not usually want a series to appear one element (column or bar) at a time. It takes too long.)
 |
 |
 Problem: Animations
Conflict
If you start applying animations on top of animations, you may find some glitches in your Slide Show. The combinations do not always play well together.
Problem: Some effects do not show at all, but to advance the slides you have to click as though the effects were there!
Problem: Some effects reveal again what was already revealed.
Solution: Change the order of animations in the Animation pane or delete some of them.
Also, be sure there are no empty placeholders on the slide, which will try to animate anyway.
Problem: An animation on a certain slide does not work well with the animation applied by the slide's master. The animations from the master cannot be deleted or edited in the animation pane. Changing the animation on the master will change it for all slides, which is not what you want!
Solution 1: Remove the animation from the master. Apply an animation to selected slides. For slides that you want to be different, apply a different animation.
Solution 2: Create a new master layout without the animation. Apply this new layout to the selected slide - not to all of the slides.
Solution 3: In the Animation Pane, right click the Master animations at the top of the pane. Choose Copy Effects to Slide. Those animations are copied to the slide and changes to the Slide Master animations will no longer affect this slide. Change the order of animations or delete the ones you do not want from the animation pane. This will affect only the selected slide!
 Step-by-Step: Animate Data
| What you will learn: | to view animation for a single slide to apply animation to an object to copy effects to slide to change Effects Options - chart by series to animate a shape |
Start with: ![]() , nz-externaldata-Lastname-Firstname.pptx from previous lesson
, nz-externaldata-Lastname-Firstname.pptx from previous lesson
About Embedded Videos:
 This lesson contains several very short MP4 videos of slide animations. Each video plays in place on the page.
There is no sound for these videos. If you hear static during playback, just mute the sound.
[These have been sucessfully run in current, March 2016, versions of Chrome, Firefox, Edge, and IE11. IE11 played them successfully from my local copy but not from the online page. So confusing!]
To play a video, you may need to move your mouse over the video to make the controls appear. Click the > arrow to play. || button pauses.
If the video won't play on the page, click the Link below it to open the video its own tab. You may have to give permission to run whatever plug-in your browser wants to use.

![]() Problem: Video player does not display correctly.
Problem: Video player does not display correctly.
[I have not seen this glitch in a while so perhaps the browsers are handling it better now.]
The object might be missing its control buttons or it might be too short. It might even include duplicates of nearby parts of the page.
Solution 1: Click on the spot where the video should be.
The object should redraw correctly.
Solution 2: Refresh the page by pressing the F5 key on the keyboard.
Solution 3: Right click on the video player object and click (or double-click) on Play/Pause.
The object should reload.
View Animation for Single Slide
The animation that you applied to the slide master applies the Fade effect to the Title placeholder and the Wipe effect to the Body. What does it do to the two charts?
|
Slide Master: Fade - Title, Wipe -Chart |
- Select the slide Rain Days to show it in the Slide Pane.
- Click
the Slide Show button
 at the bottom right.
The Slide Show opens to the current slide. The Title fades into view.
- Click the slide.
The chart wipes into view as one whole object.
- Press the ESC key to return to Normal view.
Apply Animation to an Object
You can make the chart appear in parts by choosing the correct option.
-
 Save As nz-animatedata-Lastname-Firstname.pptx to your
Class disk in the powerpoint project3 folder.
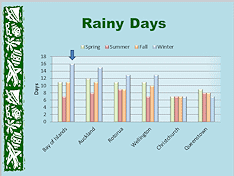
- Click on the chart to select it.
- If necessary, change to the Animations ribbon tab and open the Animation task pane.
-
 Apply the Entrance effect Fade
  .
.
 Problem:
  PowerPoint 2007 - Fade does
not show in the short list
Solution: Click on More Effects... and select it from the full list of effects.The Slide Pane automatically runs the new effect, which shows the chart fading into view as a whole. The chart is now marked at the upper left with a box with the number 1.
 The
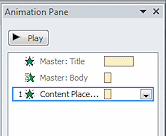
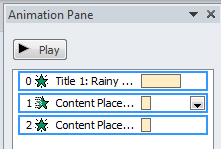
animations applied by the Slide Master are grayed out at the top of the Animation pane.
 -
Slide Master: Fade - Title, Wipe - Chart
Slide animation: Fade - Chart
Link to video
Click the Play button
 in the Animation pane.
Did you catch all of the animations: Fade (Title), Wipe (Content placeholder), Fade (Content placeholder). Play the Slide Show from this slide to see it more clearly. You need to click for the animations on the Content placeholder.As the list in the pane says, first the animations from the Master play and then the custom animation. This makes the chart wipe into view, disappear, and then fade into view. Whoops! You didn't want two effects on the same chart!
-
 Save.
Save.
[nz-animatedata-Lastname-Firstname.pptx]
Copy Effects to Slide
To keep the animation effect from the Slide Master from playing on this slide, you need to copy the effects onto the slide and then delete the ones you don't want. It's simple... when you know that you can do this! Just don't forget that if you change the Slide Master animations, this slide will not update.
-
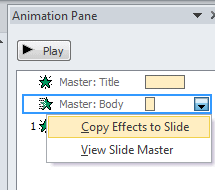 In the Animation Pane, right
click on the either Master animation.
- In the context menu, click on Copy Effects to Slide.
ALL animations applied by the Slide Master are now in the Animation pane where you can edit them.
 Save.
Save.
[nz-animatedata-Lastname-Firstname.pptx]
Change Effects Options
Now you can remove the Wipe effect and modify the Fade effect to show just part of the chart at a time.
-
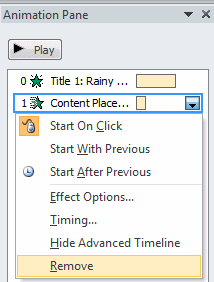 Click in a blank area below the list of animations to
Deselect them.
- Select animation #1, Content Placeholder: Wipe, by
itself.
- Right click on the animation in the list and in the context menu, click on Remove.
Only two animations are listed now.
- Click the Play button to see the animations run in the
Slide Pane.
Much smoother with the title fading in and then the chart.
-
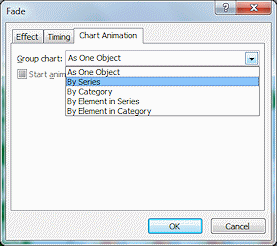
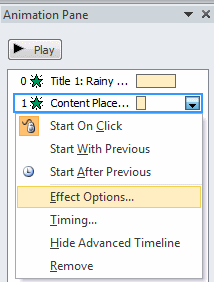 Click the down arrow at the right of the #1 animation effect (Content Placeholder) in the list in
the Animation task pane.
(Another way to get to the menu.)
-
Click on Effect Options...
The Effect Options dialog for Fade appears. - Click on the Chart Animation tab.
-
Open the list under Group chart: and select By Series.
These choices are not there for every effect.
 The check box for Start animation by drawing the chart
background is automatically checked when
you choose something besides As One Object. That is usually a good choice.
- Click on OK.
Slide animation: Fade - Title, Fade - Chart by Series
(nothing from Slide Master anymore)
Link to video
The Slide Pane plays the revised animations. The columns are revealed by series, that is, one color of columns at a time.
 Save.
Save.
[nz-animatedata-Lastname-Firstname.pptx]
Animate Shape
Did you notice that the blue down arrow is showing up with the background, long before the column it points to shows up. The shape is part of the chart so it shows up along with the axes and plot area. You cannot apply an animation to just the arrow... yet.
- Click on the blue
down arrow
 to select it.
 The animations are grayed out. The shape cannot be animated while it is part of the chart.
So, let's take it out of the chart.
 Select the arrow and copy it with
the key combo CTRL + C.
- Press the DELETE key.
The arrow disappears.
-
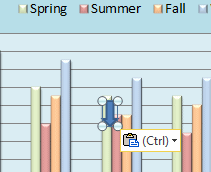 Click on the slide outside the chart.
 Paste with the key combo CTRL + V.
The blue down arrow appears again but in the middle of the slide.
- Drag the arrow back to where it was before,
pointing to the top of the tallest column.
But this time, the arrow is not inside the chart. It is floating above it. Looks the same! But Animations ribbon tab is not grayed out anymore. Whew!
With the arrow shape selected, apply the animation SwivelBlue arrow animated
Link to video
 .
.
In the Animations pane, this animation shows last in the list.
- Play the Slide Show.
Remember that the animations for the chart and the arrow require a mouse click.
Correct any errors you spot.
-
 Save.
Save.
[nz-animatedata-Lastname-Firstname.pptx]
Evaluate
![]() Do
the current animations work well with the chart? Would you prefer more action in
the animation? How about the formatting for the chart? Does it have the right
parts? the right colors?
Do
the current animations work well with the chart? Would you prefer more action in
the animation? How about the formatting for the chart? Does it have the right
parts? the right colors?
Apply What You've Learned
Now you get to make choices of your own for the Languages slide. Your goal is to apply formatting and animation to the chart on that slide to make that data visually interesting as well as readable.
- Switch to Slide #10:
Languages.
Recall that the text box about English Speakers does not inherit any animations from the Slide Master, so it is there before the title shows up. Not a happy effect.
- Add an animation effect of your choice to this text box.
- Copy the effects to the slide and change the animations so that the text box shows up before the chart appears.
-
 Experiment: Format
Object
- Select the chart and try various animation effects and their different options.
- Can you make the chart appear By Series like the Rainy Days chart, or
By Element, so that the columns appears
one at a time?
No, you cannot! Excel does not know how to do any such thing and the chart is actually in Excel, not PowerPoint. You just found the big advantage and disadvantage of embedding a chart as an object. You have the features of the original program, but ONLY those features.Examples: Animation of Languages slide
Your version can (should?) be very different from these!
Link to video Link to video
- Try out different chart types and styles.
-
Play your slide with the Play button and with Slide Show to see the effects.
Once you are happy with the slide...
-
 Save as nz-animatedata2-Lastname-Firstname.pptx to the powerpoint project3 folder on your Class drive.
