|
Exercise PowerPoint 3-2: Tables & Chart
|
What you will do: |
Create a presentation manually
Format and animate
Add tables
 Add tables to Notes page Add tables to Notes page
Add a chart to a slide
Apply custom animation to a chart
Save as template. |
Start with: blank presentation
The City Soccer League is having a management meeting to review the
last season and its budget. You will prepare a presentation for the
president to show during the discussion. It should advance by clicking
since he will be talking for a while at each slide.
- Open a new blank presentation.
- Titles: Create slides with the following titles:
Title Slide: City Soccer League
Title Slide - subtitle: End of Season Report
Slide 2: Team Standings – Level 1
Slide 3: Team Standings – Level 2
Slide 4: Budget – Grand Totals
Slide 5: Budget vs. Actual
-
 Save
to your Class disk as soccer-yearendreport.ppt . Save
to your Class disk as soccer-yearendreport.ppt .
-
 Design Template: Apply the Blends template. Design Template: Apply the Blends template.
-
Masters: Ungroup and delete the colored blocks on the Slide and
Title Masters, but leave the horizontal lines in place.
 Insert
a clip art image of a soccer player onto the Title Master and align and
resize, if necessary, the image to fit at the left of the slide along
the horizontal line. Insert
a clip art image of a soccer player onto the Title Master and align and
resize, if necessary, the image to fit at the left of the slide along
the horizontal line.
 If
you cannot find the image used here, pick a similar one or at least
something related to soccer. If
you cannot find the image used here, pick a similar one or at least
something related to soccer.
Repeat for the Slide Master.
Resize the text placeholders so that the text will not be underneath the
image you added.
-
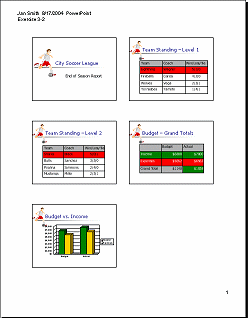
Slide 2: Team Standings - Level 1
Add the following table, clear of the image-
|
Team
|
Coach
|
Win/Loss/Tie
|
|
Lightning
|
Wagner
|
5/1/0
|
|
Fireballs
|
Garcia
|
4/2/0
|
|
Wolves
|
Vega
|
2/3/1
|
|
Tornadoes
|
Yamoto
|
1/4/1
|
Use the Drawing bar's
 Fill button to color the background of selected cells.
- Slide 3: Team Standings - Level 2
Add the following table -
|
Team
|
Coach
|
Win/Loss/Tie
|
|
Sharks
|
Black
|
5/0/1
|
|
Bulls
|
Sanchez
|
3/3/0
|
|
Piranha
|
Simmons
|
2/4/0
|
|
Mustangs
|
Miller
|
2/3/1
|
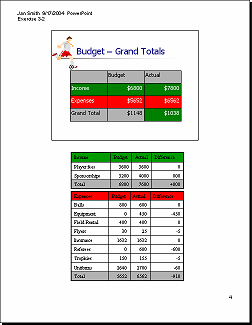
- Slide 4: Budget - Grand Totals
Add the following table -
| |
Budget
|
Actual
|
|
Income
|
$6800
|
$7600
|
|
Expenses
|
$5652
|
$6562
|
|
Grand Total
|
$1148
|
$1038
|
- Slide 5: Budget vs. Actual
Add a chart using the data from the first 3 rows on the table on
Slide 4.
Format the Income data series to use the same Green color as in the
table instead of the lighter green that is in the Color Scheme.
- Notes: Add to the Notes page for Slide 4: Budget - Grand
Totals the tables that breakdown the sources of income and the expense
items.
Printable page of tables
| Income |
Budget |
Actual |
Difference |
| Players fees |
3600 |
3600 |
0 |
| Sponsorship |
3200 |
4000 |
800 |
| Total |
6800 |
7600 |
800 |
| Expenses |
Budget |
Actual |
Difference |
| Balls |
800 |
600 |
200 |
| Equipment |
0 |
450 |
-450 |
| Field Rental |
400 |
400 |
0 |
| Flyers |
30 |
25 |
5 |
| Insurance |
1632 |
1632 |
0 |
| Referees |
0 |
600 |
-600 |
| Trophies |
150 |
155 |
-5 |
| Uniforms |
2640 |
2700 |
-60 |
|
Totals |
5652 |
6562 |
-910 |
- Transitions and Animations:
Apply the Faded Zoom animation scheme to All Slides. (No transition.
Faded Zoom for Title, and Fade for Body)
Apply the Fade custom animation to each table and to the chart, with the
option to group by series.
-
 Save.
[soccer-yearendreport.ppt] Save.
[soccer-yearendreport.ppt]
 Print a handout (6 slides per page) with your name, the date,
and PowerPoint Exercise 3-2 in the header.
 Print the Notes page for just Slide 4: Budget - Grand Totals.


-
 Save
your presentation as a design template to your Class disk with the name
citysoccerleague.pot . Save
your presentation as a design template to your Class disk with the name
citysoccerleague.pot .
-
 Save
as a Web Page to your Class disk with the name
soccer-yearendreport.htm . Save
as a Web Page to your Class disk with the name
soccer-yearendreport.htm .
- View your web page in a browser.
 Tables
and chart missing: After a slide's title appears, click on the slide
to allow the table or chart to appear. Then click the arrow to advance
to the next slide. Tables
and chart missing: After a slide's title appears, click on the slide
to allow the table or chart to appear. Then click the arrow to advance
to the next slide.
|

