 |
Step-by-Step:Import Data |
 |
What you will learn: |
to insert a file as an object
to select a sheet to display
to format imported data
to use TAB to select a covered object |
Start with:  ,
nz-chart.ppt from previous lesson,
nz-languages.xls from your
resource files
The Story So Far:
You are creating a presentation on New Zealand for
World Travel Inc.
You will add a chart
about what languages are spoken in New Zealand. The main language of New Zealand is
English and most World Travel Inc. customers speak some English, but
English is not the native language for many customers.
A co-worker has found
some
tables from the census office in New
Zealand about the languages spoken, but there is more there than anyone probably wants to know! She created
an Excel file,
nz-languages.xls, using some of that data. You will import a
chart from that spreadsheet.
- If necessary, open
nz-chart.ppt from your Class disk.
-
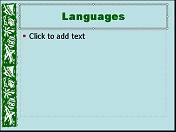 Add a new slide to follow
Rain Days.
- Type as the new slide's title Languages .
-
 Save
As nz-import.ppt to your Class
disk.
 How to handle a full Class disk
Import Data
When you import data into PowerPoint, you are bringing in a whole file. For
Excel files, you can choose which sheet is displayed on the slide.
-
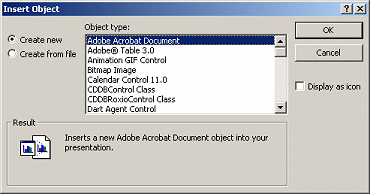 From the menu select |
The Insert Object dialog
appears.
-
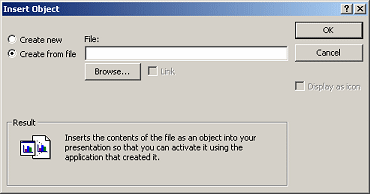 Click on the radio button (circle) for Create
from file and then click the Browse Button.
The Browse dialog opens.
- Navigate to the resource files on your hard disk and select
nz-languages.xls
or enter the path
c:\My Documents\complit101\presentations\nz-languages.xls
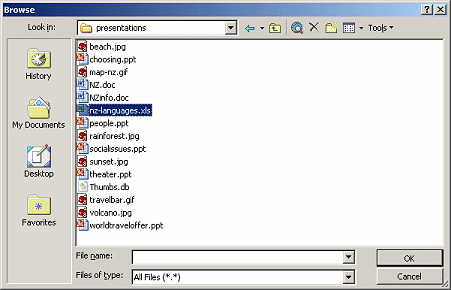
If you do not find this file on your hard disk, you can
download it.
- Click on OK. The Insert Object dialog changes to show
the path to the file you selected.

-
 Click
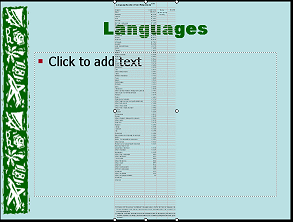
on OK. The sheet that was showing when the file was last saved is
displayed on the slide, centered.
Ick! What a horrible table for a slide. Far too many table entries and text is
far too small.
Before
making any formatting changes, let's look at this file in Excel and see if there is something
else there that you
can use instead!
 If
AutoLayout is on, the table will be sized smaller to fit in the Body
placeholder. Makes a bad situation even worse!
Open Object
One of the advantages of importing your data as an object is that you can
edit it in place with the original program. It's as easy as a double-click!
- Double-click the table on the Language
slide. Several things change!
- The table turns into a spreadsheet.
- The toolbars change to Excel toolbars.
- Navigation buttons from Excel show up at the bottom of the table.
- Menus change to Excel menus
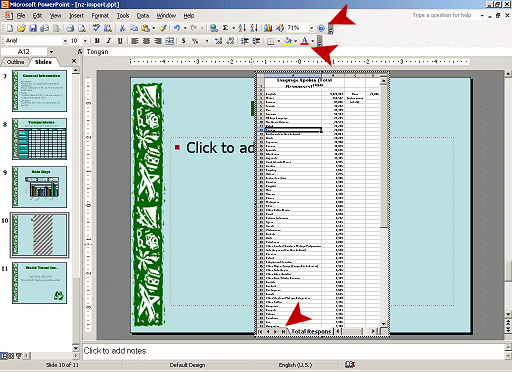
These changes happen only if you have Microsoft Excel installed on the
computer.
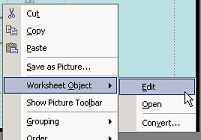 Alternate
method: Right click the table. From the popup menu choose Worksheet Object
and then Edit.
-
 Click
on the right arrow in the navigation bar at the bottom of the
spreadsheet. There are two more sheets in this Excel file.
If the spreadsheet is too narrow to read the full chart names, you can resize
it by dragging on one of the resizing handles.
-
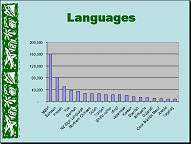
 Click
on the last tab, Chart-Non-English Languages. The
display changes to show the chart sheet.
You need to resize and position this object!
Edit Object
While your object (the spreadsheet) is in this window, you can make changes.
Since you did not Link this object back to the original file, your changes
don't affect the original at all. You are free to play!
-
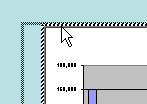 If
your chart is off the slide to the right, move your mouse pointer
to the inside edge of the border and drag left. The mouse
pointer does NOT change shape in this case.
-
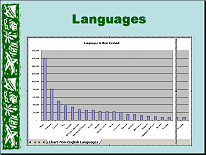 Resize the chart by dragging the corner handles.
(The display may look like overlapping charts but there aren't really two of
them.)
You don't need the chart title so let's remove it.
-
 Click
on the chart title to select it.
- Press the DELETE key. The whole chart resizes to use the space.
You can change the font and remove some of the numbers to make the axes easier
to read.
-
 Right
click on the number labels for the Y-axis.
-
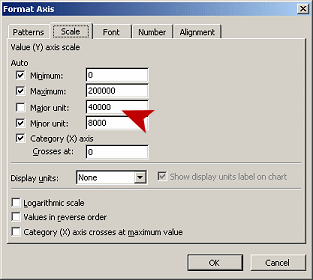 Select
the Scale tab.
- Change the major unit to 40000.
-
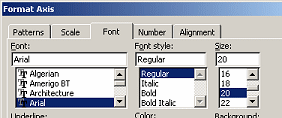 Select
the Font tab.
- Change the font size to 20.
- Click on OK.
- Right click on the language names across the bottom (the
X-axis) and select .
- In the Format Axis dialog, select the Font tab and set
the Font Size to 20.
-
Click
on OK.
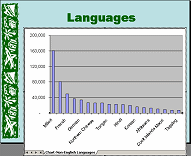
 Chart frame
is off the slide at the bottom:
You need to change the Zoom setting to see the bottom of the frame. If you try to scroll to
see it, you will probably slip over to the next slide. So frustrating!
 On
the Formatting toolbar, change the Zoom to the next smaller
percentage. Can you see the handles at the bottom of the chart's frame? If
not, try smaller Zoom settings until you can see the handles.
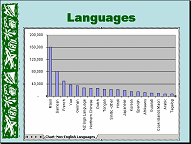 Drag
the bottom center handle up until the chart frame is fully onto the
slide. The language labels may turn vertical, as in the illustration at the
right.
When you resized the chart, the font size for the axes labels may have dropped
from 20 to 18.
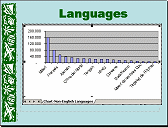
 Chart
area is too small: Drag the bottom edge of the chart frame down to the
edge of the slide.
-
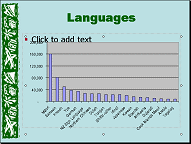 Click
on the slide, outside of the chart area.
The Excel features vanish and those finicky labels slant again. Your chart may
look different if its size is different.
So confusing when what you see while editing is not what you see on the
slide!!
Select & Delete Placeholder Under Chart
Is the original text placeholder is still here underneath the chart?
It won't show when the slide is shown. But you can get rid of it.
You will to use a new technique to get at it. The TAB key comes to the
rescue!
(Even if your text placeholder vanished, read through the steps to see
how get to an object that is covered by another object.)
-
 Click
on the words Click to add text to try to
select the placeholder. Did the placeholder's border turn to dots? Probably
not. As the illustration at the right shows, the circle
handles for the chart are showing.
Since the chart is stacked on top of the placeholder, it was covering those
words.
-
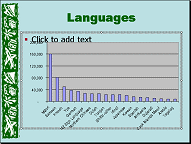 Press
the TAB key on your keyboard. The Title text box is selected.
- Press TAB again. NOW the text placeholder is selected.
- Press the DELETE key. The placeholder vanishes. Much
neater!
Alternate method- Change Stacking Order: Select the chart. From
the Drawing bar, click the Draw button and select |. This puts the chart
underneath the text box. Now you can select the text box and delete it.
Add Text Box and Format
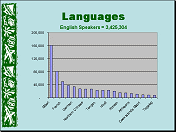
The chart does not include the number of people who speak English. The bar
for English would be so tall that the other bars would be impossible to read!
You can add that information in a text box, as a kind of subtitle for the
slide.
- Create Text Box: On the Drawing bar, click the Text Box button
 .
When you move your mouse over the slide, the pointer changes to
 vertical bar with a small
crossbar near the bottom.
-
 Click
underneath the Title placeholder. A small text box appears with the cursor in
it, ready for your typing.
- Enter Text: Type: English Speakers = 3,425,304
 With this method, the text box will be
exactly wide enough to hold your
text.
-
Format the text:
Font Size = 20
Color = Green
Bold
The text box is probably not centered under the title, depending on exactly where you clicked
to create it.
-
 Align
Text Box:
Horizontally: While the new text box is selected, hold the SHIFT key down
and click on the Title placeholder, Languages, to add it to the selection. On the Drawing bar, select | | .
The placeholder and the text box line up neatly over each other.
Vertically: Select the Title placeholder, the English Speakers text box
and the chart. From the Draw menu select | | . The three items are rearranged neatly, even though
the text box must overlap the others.
-
Click onto a blank area of the slide to deselect the objects.
-
 Save.
[nz-import.ppt]
 How to handle a full Class disk
- Play the Slide Show starting with this slide.
Hmmm. The title and chart are animated, using the Slide Master settings, but
the text box appears when the slide shows up. Perhaps you can fix this unhappy
state in the next lesson.
Evaluate
 Is the chart working
well on this slide? What was the purpose for this presentation? Will this slide help
accomplish that purpose?
The font size may have changed to 18 for the numbers and
languages. (It changes automatically when you resize the chart.) This is
OK for viewing on a monitor. It may be too small to do much good on a
projection screen in a large room.
~~ 1 Cor. 10:31 ...whatever you do, do it all for the
glory of God. ~~

